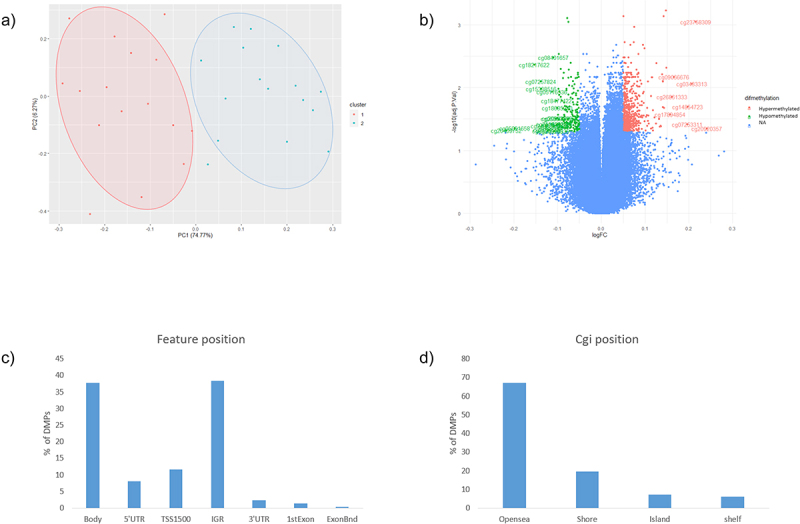
Figure 1.

a) Principal component analysis between GDM (blue, cluster 2) and non-GDM (Red, cluster 1) b) Volcano plot, green: CpGs most hypometylated, red: most hypermethylated, blue: non-significant. c) DMPs according with feature position in the gene d) DMPs according with island position (Cgi position).
