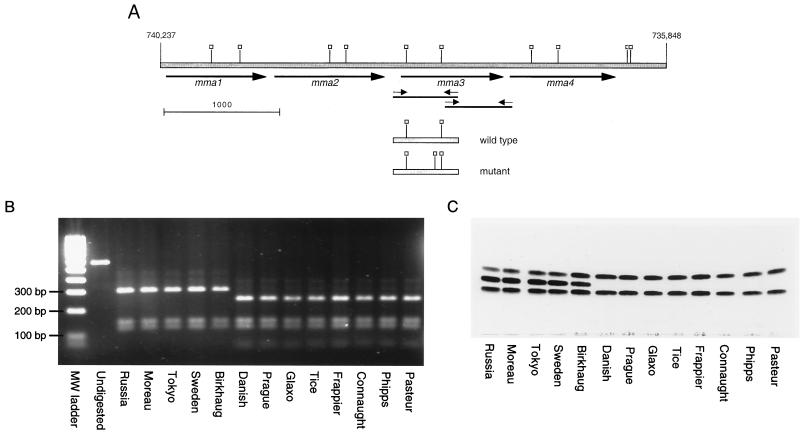
FIG. 1.
Genetic and phenotypic analysis of BCG methoxymycolic acid production. (A) Map of the gene locus responsible for the production of methoxymycolates. The shaded bar represents genomic DNA, with numerical locations on the chromosome of strain H37Rv indicated (6). The heavy arrows indicate methyltransferase open reading frames. Small arrows indicate primers used to amplify the 5′ and 3′ regions of mma3. Thin solid lines represent the PCR products. Open squares, SalI sites. Shown below the genomic regions are the amplicons from wild-type and mutant mma3 5′ regions, with SalI sites indicated (note the additional site in the mutant mma3). Scale marker, 1,000 bp. (B) Purified 562-bp PCR products containing the 5′ end of the mma3 gene from the 13 BCG strains were digested with SalI. Without digestion, a 562-bp product is seen. After incubation, the wild-type strains have three fragments of 303, 144, and 115 bp, while the mutant strains have four fragments of 246, 144, 115, and 57 bp. (C) TLC analysis of purified mycolic acids from various BCG substrains. The same BCG strains shown in the PCR-RFLP gel were analyzed by TLC for production of mycolic acids as described in Materials and Methods. The three bands obtained represent (from bottom to top) ketomycolates, methoxymycolates, and α-mycolates. It is seen in this figure that eight BCG strains lack methoxymycolates. These are the same strains that gave the extra SalI band; they represent strains of BCG obtained from the Pasteur Institute in 1931 or later.

