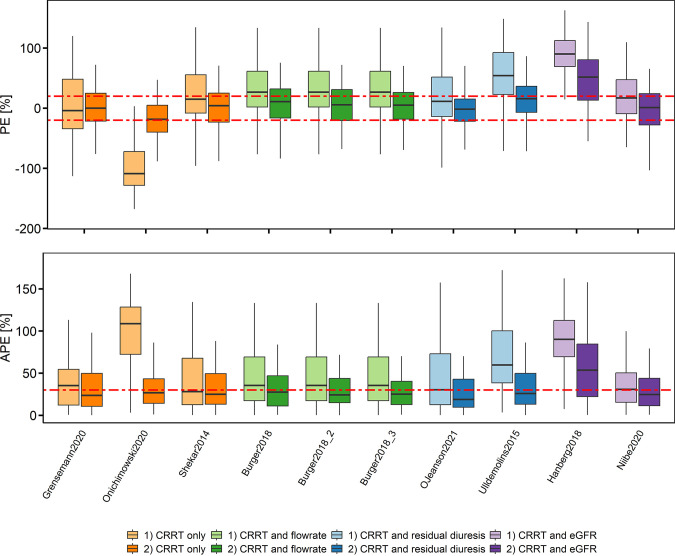
FIG 2.
Relative prediction error (PE) and the relative absolute prediction error (APE) of the predicted versus the observed meropenem concentrations for the trough concentration of the second dosing occasion for i) a priori prediction using the patient covariates only, and ii) Bayesian forecasting prediction using the last measured concentration of the first dosing occasion. The models were grouped according to the included covariates on clearance. Box plots represent the 25th, 50th, and 75th percentiles; the whiskers cover the 1.5-fold interquartile range; red dashed line represents clinically acceptable values ±20% for PE and 30% for APE. Burger et al. 2018 (25) is presented with three different residual errors published.

