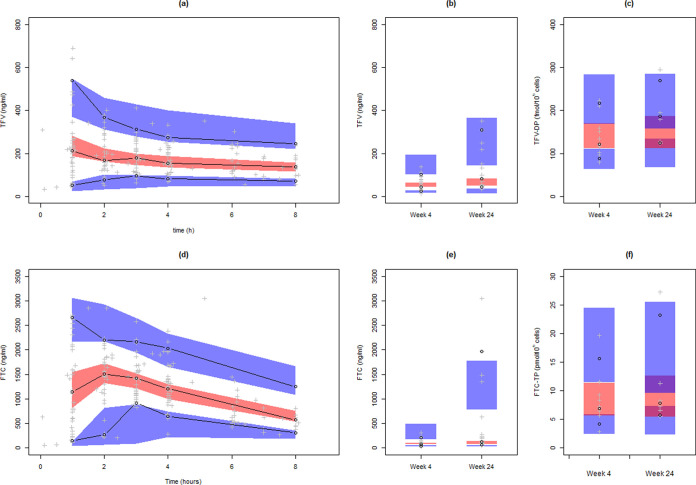
FIG 3.
Visual predictive check plots using the combined model inclusive of all covariate effects for TFV and FTC profiles sampled in the clinic at week 4 (a and d), for the predose concentrations at weeks 4 and 24 (b and e), and for TFV-DP and FTC-TP concentrations at weeks 4 and 24 (c and f). The three bands represent the 90% confidence intervals around the 5th, 50th, and 95th predicted percentiles. The black dots and lines represent the 5th, 50th, and 95th observed percentiles.

