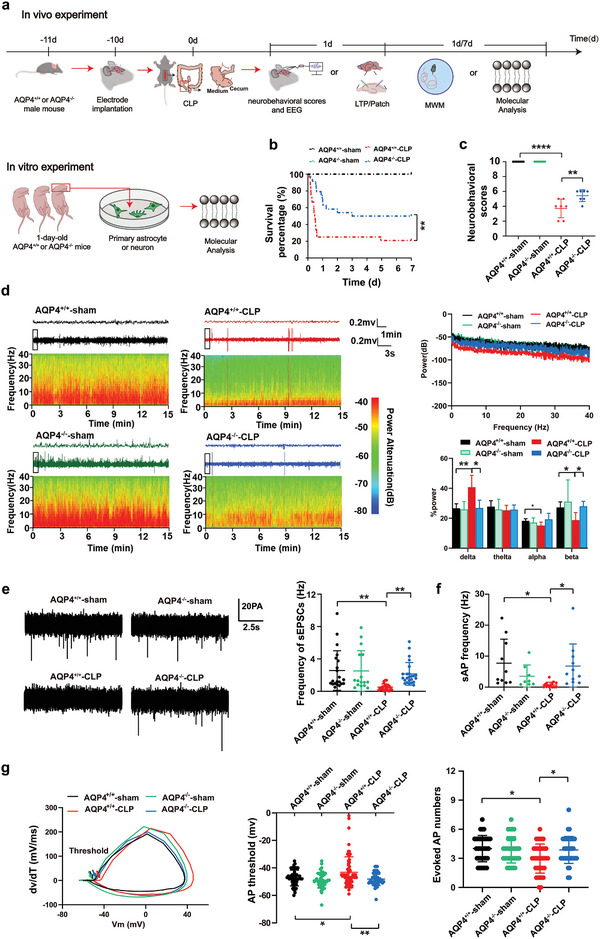
Figure 2.

AQP4 deletion improved survival rate and ameliorated sepsis‐induced neurologic injury in brain of CLP‐induced sepsis in mice. a) The program of septic model preparation and arrangement of EEG and neurological score in the present study. b) The survival curve analysis is of the survival rates representing each group mice after modeling. n = 24 mice for each group. c) The neurobehavioral score which reflects the neurological injury of mice. n = 7 mice for each group. d) Relative EEG analysis of different groups of mice included EEG spectrum (left), EEG average power spectrum (upper right), average power percentage of α, β, δ, θ waves (lower right), n = 4–6 mice per group. e) Spontaneous EPSCs were recorded. The representative sEPSC traces and quantification of sEPSC frequency are shown in (e). Neurons from 6 mice per group. f) Spontaneous action potential was recorded and quantification of sAP frequency is shown in (f). Neurons from 6 mice. g) The 1st derivative of the somatic membrane voltage (dV/dt) versus membrane voltage (V m) in phase plot. The arrow points to the action potential voltage threshold (left). Quantification of evoked AP thresholds (middle) and quantification of evoked AP numbers (right). Neurons from 6 mice. b) Log‐rank (Mantel‐Cox) test was used. c–g) Data are presented as mean ± SD. * p < 0.05, **p < 0.01, ****p < 0.0001; two‐way ANOVA with Tukey's post hoc test.
