
Figure 4.
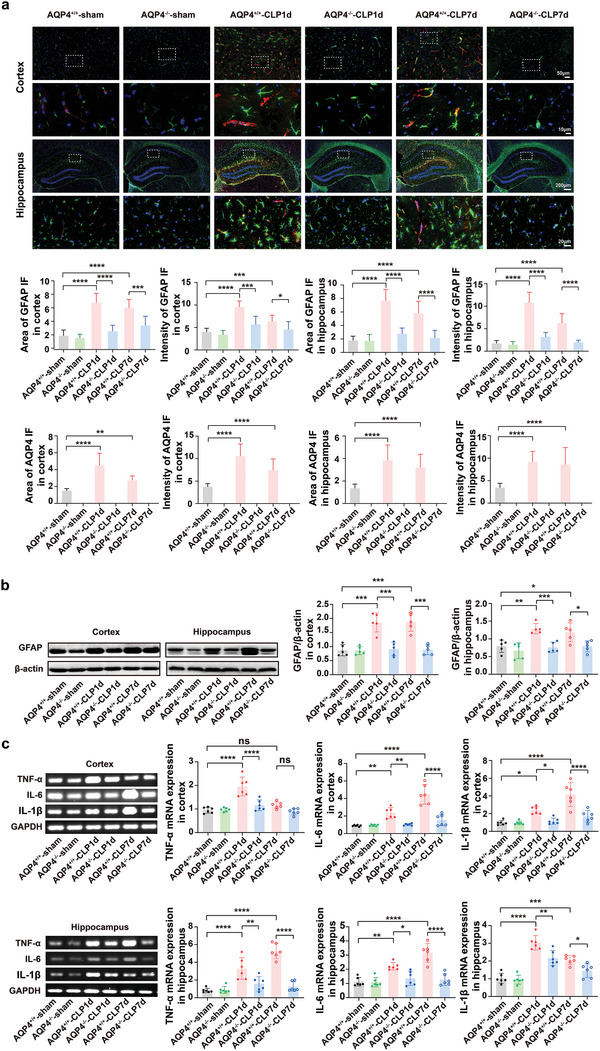
AQP4 knockout diminished astrocyte activation and mitigated the inflammatory cytokine response in septic mice. a) Immunofluorescence of GFAP+(green) astrocytes and AQP4 (red) in cortex and hippocampus of mice brain slice(upper), different magnification scale bar respectively: 50 µm; 10 µm; 200 µm; 20 µm. Middle and lower panel, quantification of area and intensity of GFAP and AQP4 in the mice cortex and hippocampus among different groups. n = 9 mice for each group. b) Representative Western blot bands of the GFAP expression levels in cortex and hippocampus of mice (left); right panel, quantification of GFAP/β‐actin in the mice cortex and hippocampus among different groups. n = 5 mice for each group. c) Representative RT‐PCR bands of the TNF‐α, IL‐6, IL‐1β mRNA expression levels in cortex of mice (upper left); upper right, quantification of TNF‐α, IL‐6, IL‐1β in the mice cortex was done and normalized to the mRNA level of GAPDH among different groups. Representative RT‐PCR bands of the TNF‐α, IL‐6, IL‐1β mRNA expression levels in hippocampus of mice (lower left); lower right, quantification of TNF‐α, IL‐6, IL‐1β was done and normalized to the mRNA level of GAPDH in the mice hippocampus among different groups. n = 6 mice for each group. Data are presented as mean ± SD. * p < 0.05, ** p < 0.01, *** p < 0.001, **** p < 0.0001; one‐way ANOVA with Tukey's post hoc test.