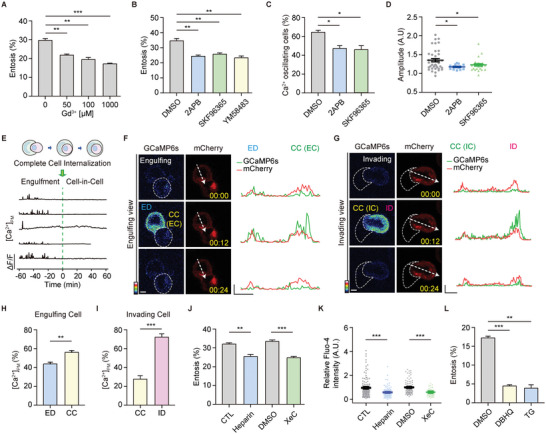
Figure 2.

Entotic cells show polarized Ca2+ signals during entosis. A) Bar graph showing entosis efficiency after 3 h. Entotic cells were quantified with Gd3+ in the dose‐dependent manner. Data represent mean ± SEM of triplicate experiments (n > 200 for each). B) Quantification of entotic cells in SOC channel blockers; 2‐APB (50 µm), SKF96365 (10 µm), and YM58483 (10 µm) compared with the control (DMSO). Cell suspensions were cultured with each inhibitor for 4 h. Data represent mean ± SEM of the triplicate experiments (n > 300 in each experimental group). C) Quantification of Ca2+ oscillating cells in DMSO, 2‐APB, and SKF96365 from (Figure S4, Supporting Information). Higher Ca2+ levels, defined by setting the threshold to 1.5× above the standard deviation, were counted as Ca2+ signals (n = 28, 19, and 24). D) Quantitative comparisons of spontaneous Ca2+ signals measured using GCaMP6s (GCaMP6s/mCherry). The compared quantities were peak amplitudes ∆F/F ratios. Data represent mean ± SEM. E) Graph of normalized GCaMP6s‐CAAX ratio in entotic cells. F,G) Local Ca2+ influx was reported using GCaMP6s‐CAAX, the PM Ca2+ indicator, in engulfing (F) and invading (G) cells. Line scan profile analysis of mCherry‐GcaMP6s‐CAAX signal. Scale bar = 5 µm. X axis: 5 µm, Y axis: 500. H,I) Bar graphs of the Ca2+ peak amplitudes in cell contact site and distal region of engulfing (n = 5) (H) and invading (n = 4) cells (I). Data represent mean ± SEM. J) Quantification of entotic cells cultured for 4 h with IP3R inhibitor, heparin (400 µg mL−1), and Xestospongin C (4 µm). Data represent mean ± SEM of triplicate experiments (n > 300 in each experimental group). K) Intracellular Ca2+ levels of MCF7 cells in suspension with control (n = 124) and heparin (400 µg mL−1, n = 102), and DMSO (n = 93) and Xestospongin C (4 µm, n = 59). Fluo‐4 intensity quantification data represent mean ± SEM. L) Quantification of entotic cells cultured for 2.5 h in SERCA inhibitors, DBHQ (25 µm), and TG (1 µm). Data represent mean ± SEM of duplicate experiments (n > 200 in each experimental group). Significance was determined using unpaired two‐tailed t‐test. ***p < 0.001; **p < 0.01; and *p < 0.05. ED: engulfing cell distal region; CC: cell‐cell contact site; ID: invading cell distal region.
