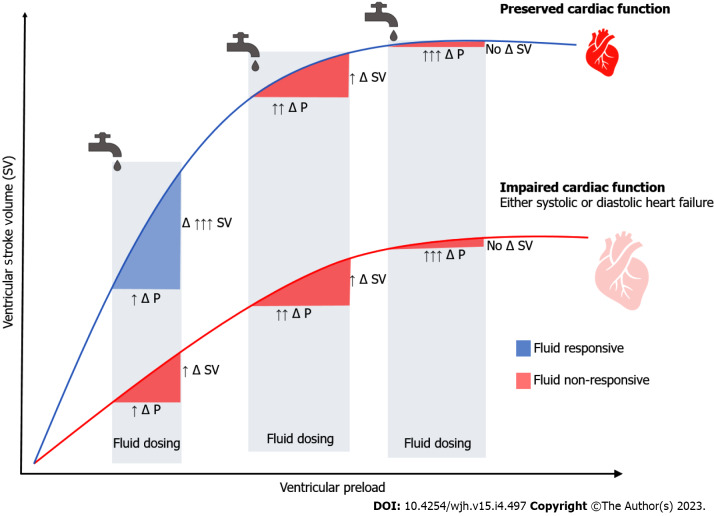
Figure 2.
Frank-Starling curves in septic shock. Every fluid bolus will lead in a change in pressure (Δ P) and a change in stroke volume (Δ SV). The effect of fluids on cardiac output among patients with normal (upper curve) and impaired (lower curve) myocardial function is depicted. Even among patients with normal myocardial reserve, excess fluid administration may significantly increase pressure without significantly increasing stroke volume, which may ultimately lead to anasarca. Δ P: Change in pressure; Δ SV: Change in stroke volume.

