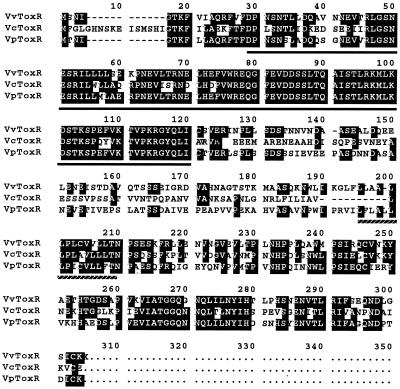
FIG. 3.
Comparison of ToxRVv with ToxRVc and ToxRVp at the deduced amino acid sequence level. The amino acid sequences were aligned for maximum homology using the MacDNASIS software (Hitachi). Dashes indicate missing sequences. Identical sequences are indicated by a black background. Solid underlining indicates the region supposed to be the transcription activation domain that binds to target promoter sequences (24, 31). Broken underlining indicates the putative transmembrane domain of ToxRVv (24, 31).

