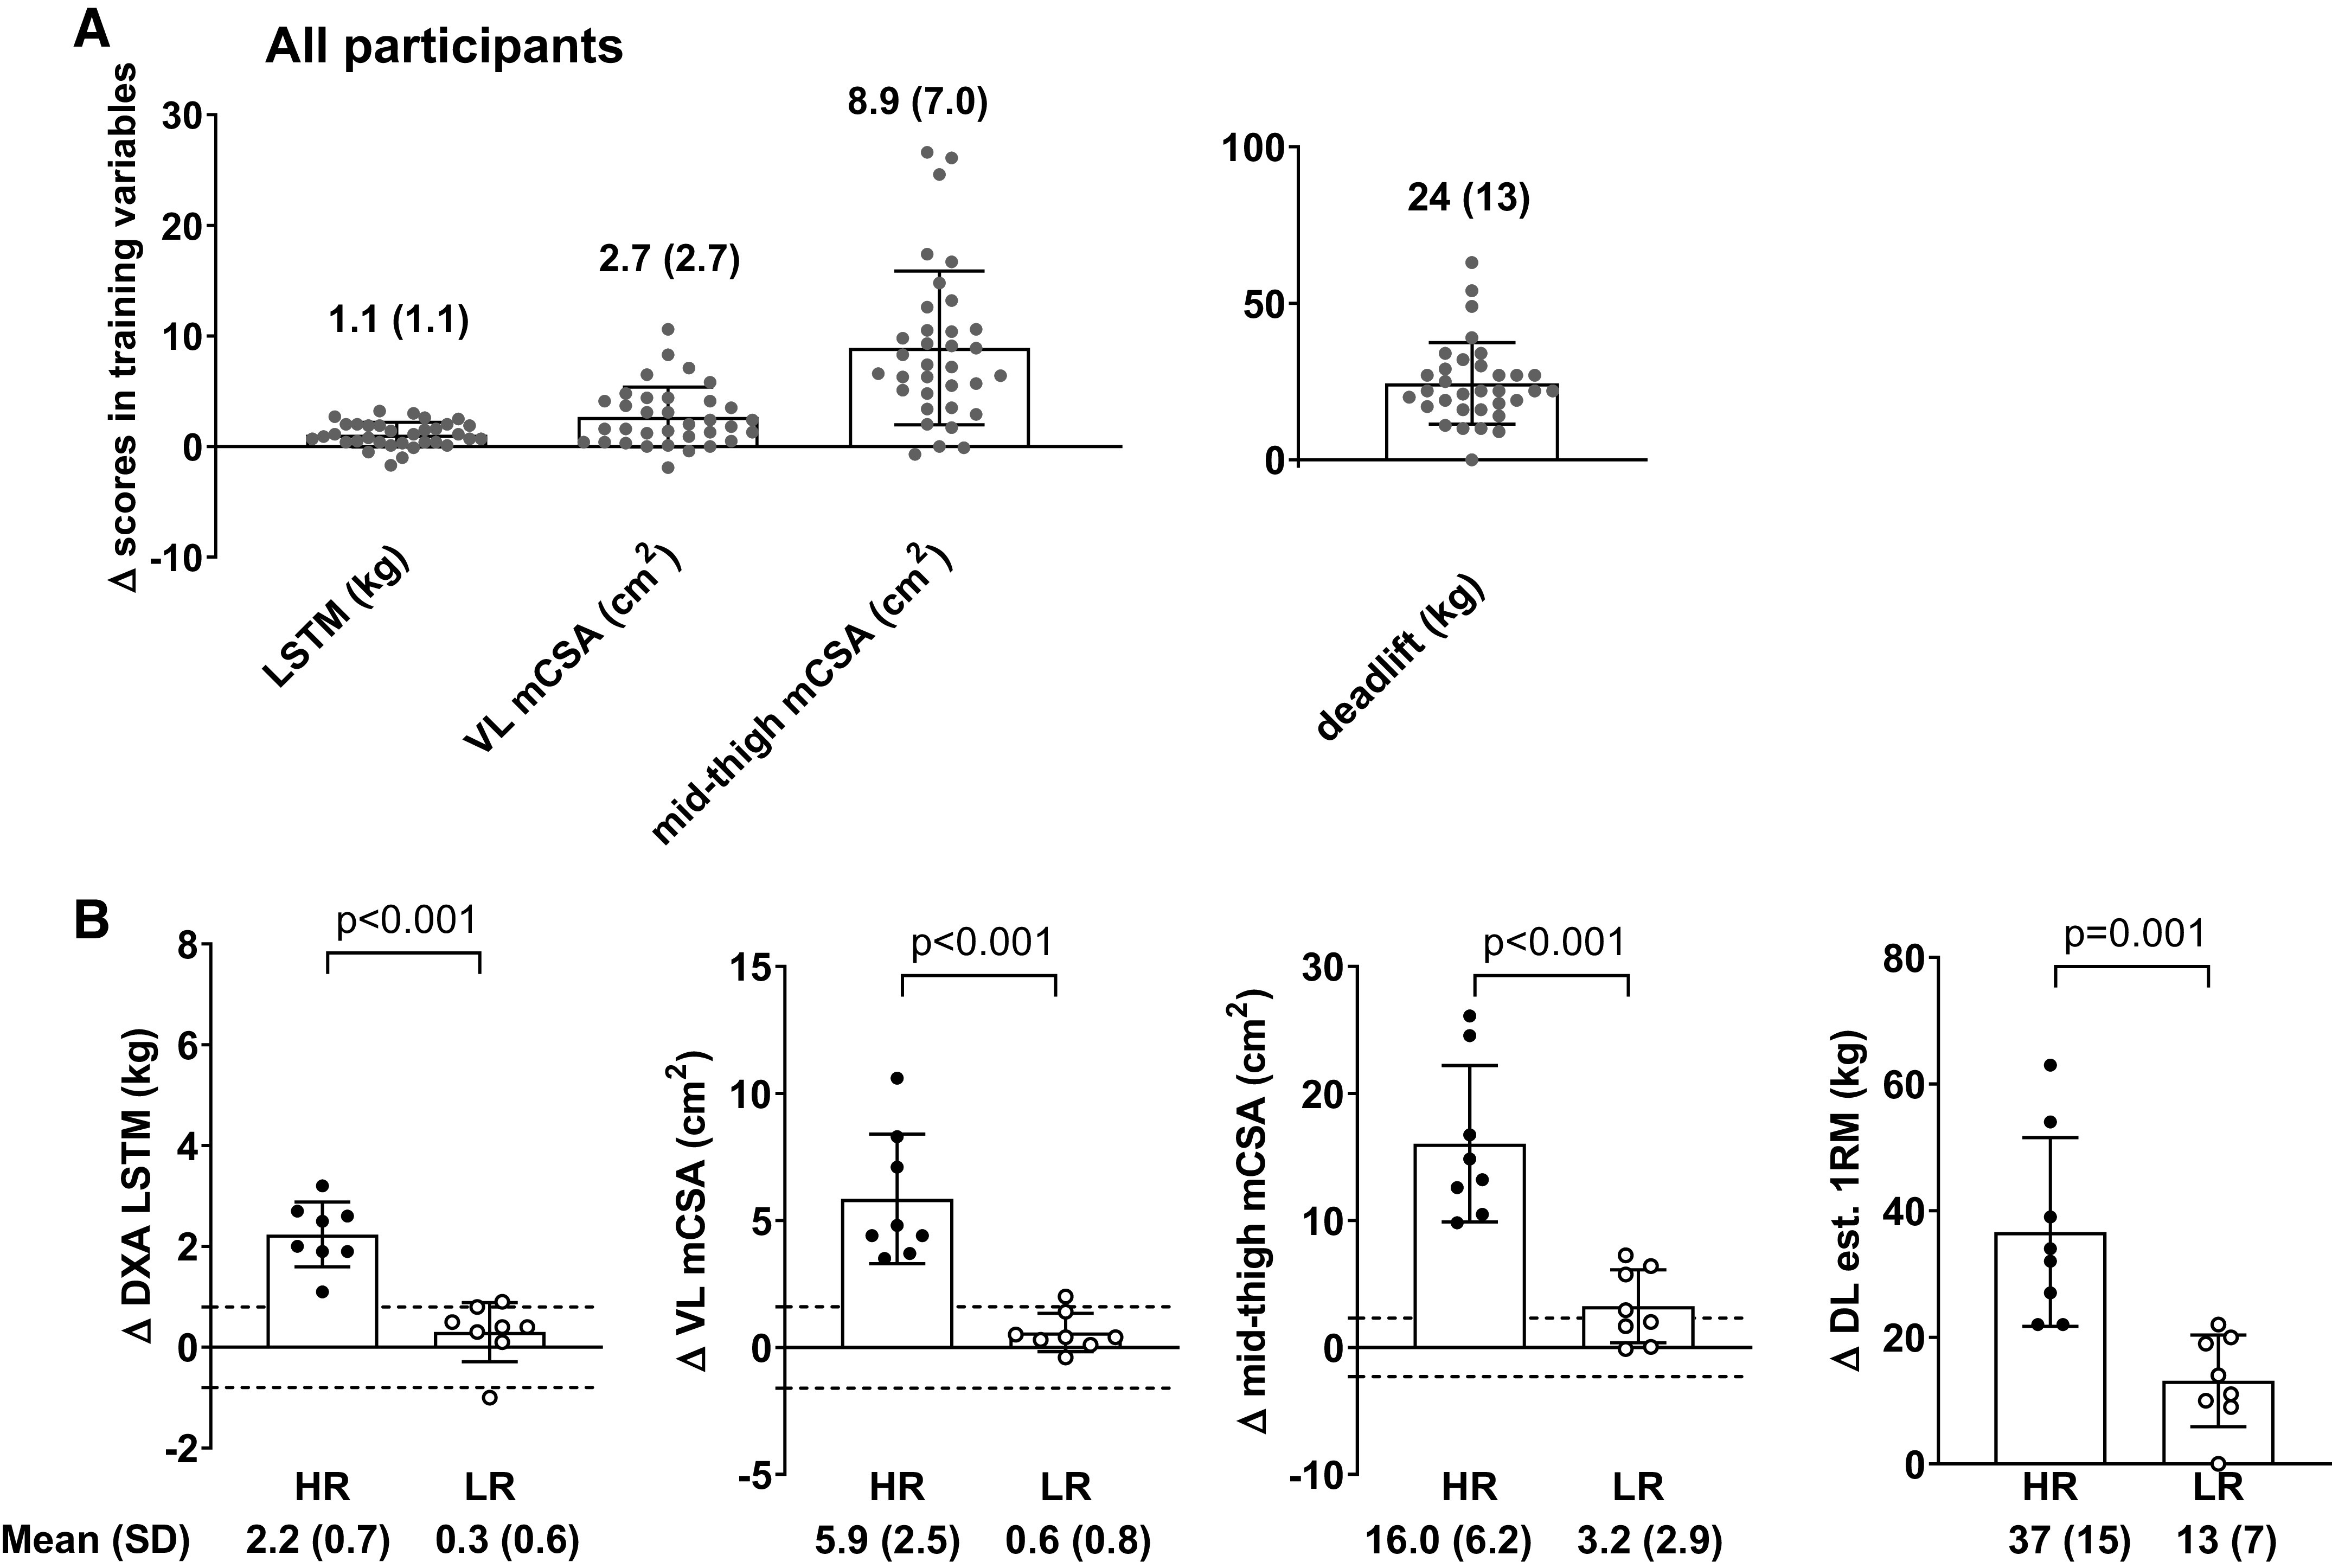
Figure 2.

Adaptations in variables used for classifying response groups. A: pre- to postintervention change scores for outcome variables used to generate response groups in all 34 female participants. B: pre- to postintervention change score differences between the higher (n = 8) and lower (n = 8) responders. For DXA LSTM, VL mCSA, and midthigh mCSA, dashed lines in B represent minimal difference scores based on test-retest statistics discussed in methods. All bar graphs are expressed as means ± SD values and contain individual respondent values as well. DXA, dual energy X-ray absorptiometry; HR, higher responder; LR, lower responder; LSTM, lean/soft tissue mass; mCSA, muscle cross-sectional area; VL, vastus lateralis; 1RM, 1-repetition maximum; DL est., deadlift estimated.
