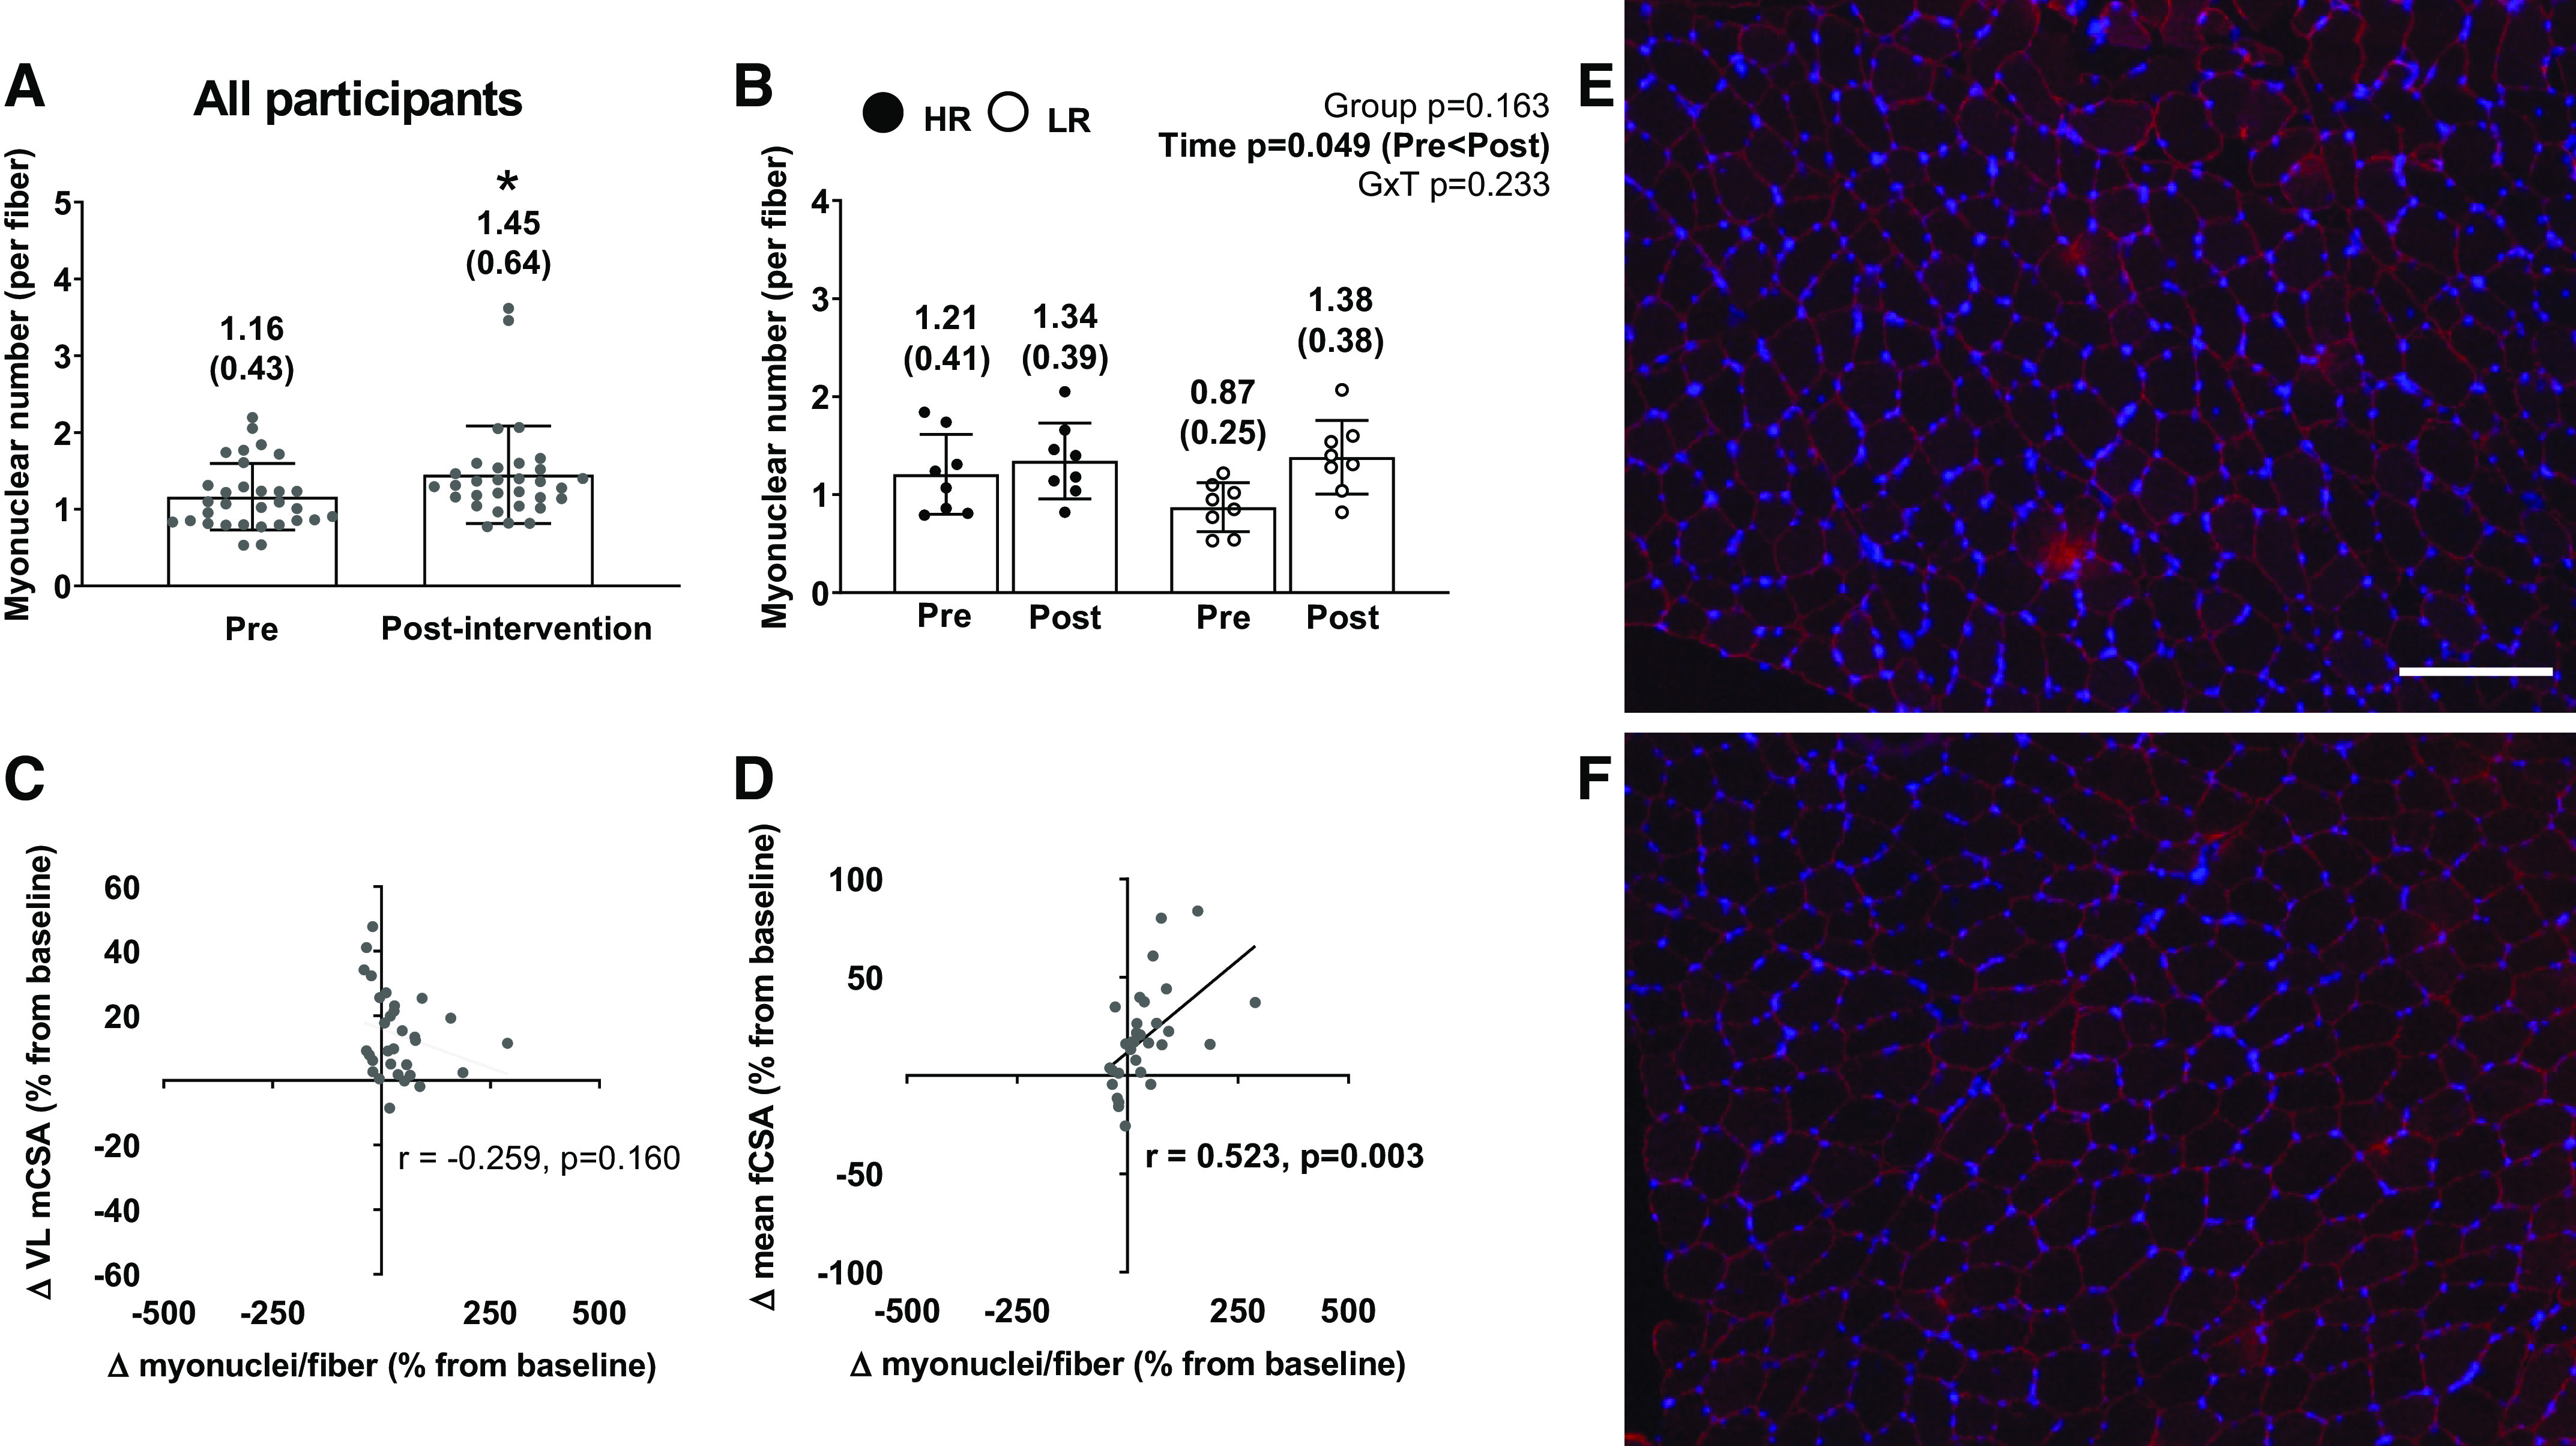
Figure 6.

The myonuclear response to training in all participants and higher vs. lower responders. A: myonuclear number response to 10 wk of training in the 31 of 34 female participants that yielded enough tissue for analyses. B: same values as in A between the higher (n = 8) and lower (n = 8) responders. All bar graphs are expressed as means ± SD values and contain individual respondent values as well. C: scatterplot showing the association between the pre- to postchange in myonuclear number and the pre- to postchange in VL mCSA in all participants. D: scatterplot showing the association between pre- to postchange in myonuclear number and the pre- to postchange in mean fCSA in all participants. E and F: ×10 representative image of PRE (E) and representative image of POST (F) of the same participant (colors: red, dystrophin; blue, DAPI; white scale bar = 200 µm). mCSA, muscle cross-sectional area; fCSA, fiber cross-sectional area; GxT, group × time interaction; HR, higher responder; LR, lower responder.
