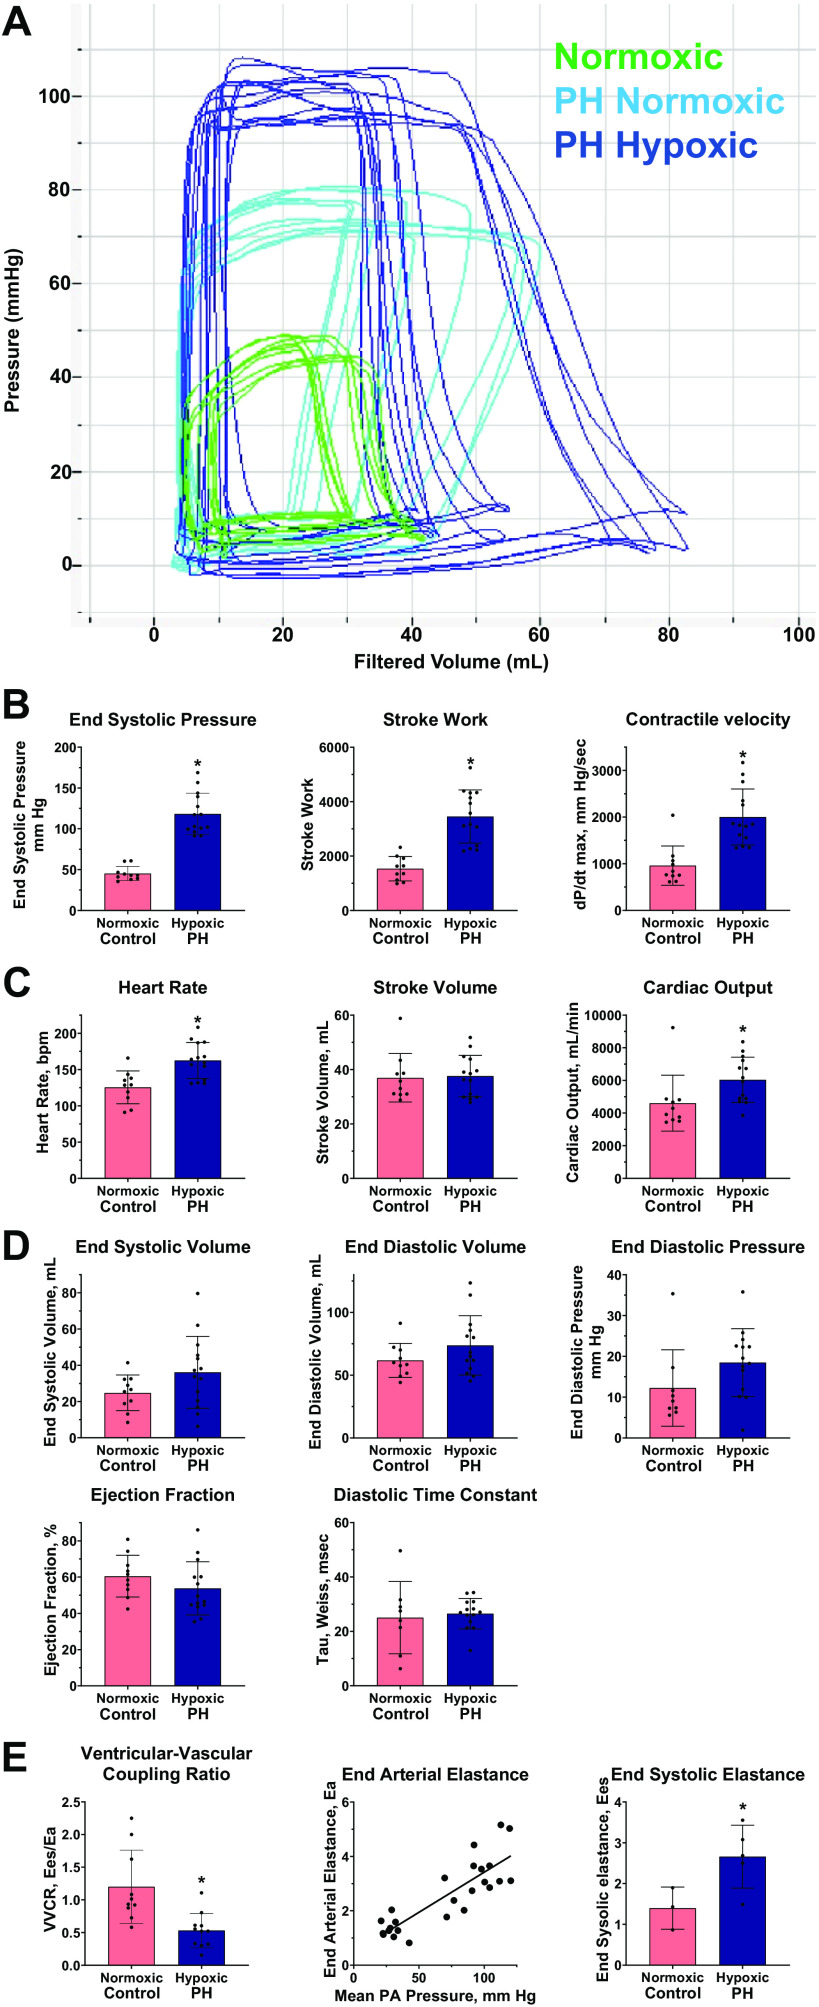
Figure 1.
Right ventricular (RV) pressure-volume (P-V) analysis. Right heart catheterization and measurement of RV P-V relationships were performed as described in materials and methods. Quantitative values are summarized in Table 1. *P < 0.05 , pulmonary hypertension (PH)-hypoxia vs. control-normoxia. A: representative pressure-volume tracings from a control calf in normoxic conditions (green lines); and from a calf exposed with hypoxia-induced PH, measured in hypoxic conditions (dark blue lines) and following transient return to normoxia (light blue lines). B: RV contractility. C: RV output. bpm, beats/min. D: parameters of RV filling and diastolic function. E: component analysis of RV ventricular-vascular coupling (VVCR). Left: single-beat hemodynamic analysis of ventricular vascular coupling ratio, Ees/Ea. Digital recordings of RV pressures from indicated animals were analyzed to determine Ees/Ea as described in materials and methods. Middle: pulmonary artery (PA) end-arterial elastance. PA end-arterial elastance (Ea) was determined directly from P-V loop relationships. The relationship to mean PA pressure was determined by linear regression. Right: RV end-systolic elastance (Ees) was calculated from animals for which both P-V analysis and determination of ventricular-vascular coupling ratio were performed.

