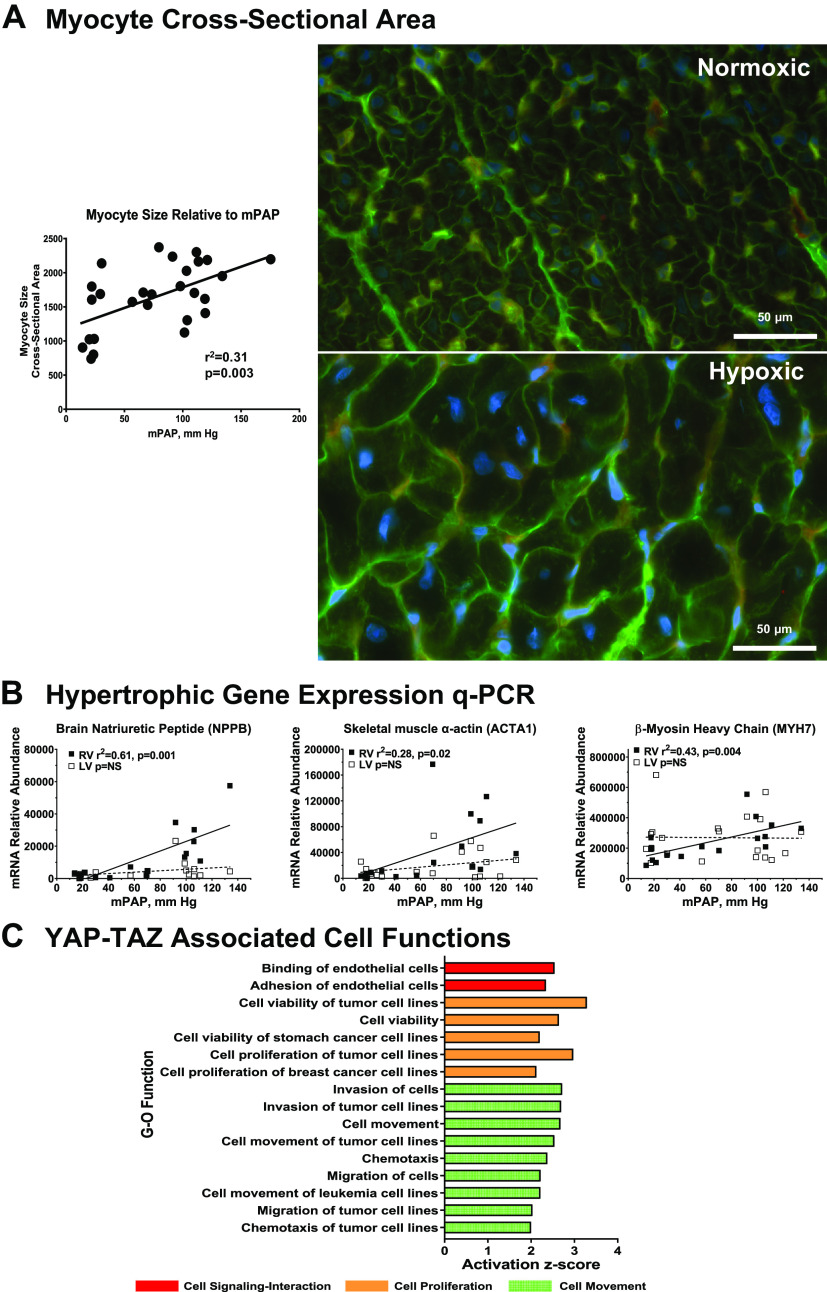
Figure 4.
Molecular and cellular correlates of right ventricular (RV) hypertrophic remodeling in hypoxia-induced pulmonary hypertension (PH). A: myocyte cross-sectional area determined by quantitative morphometry. Histochemical staining with wheat germ agglutinin and morphometric analysis of myocyte size were performed as described in materials and methods. Right: representative images of RV sections from control (n = 9) and PH (n = 11) calves. Left: relationship between myocyte size and mean pulmonary artery (PA) pressure determined by linear regression. B: quantitative PCR evaluation of hypertrophic gene expression. Abundances of the indicated mRNAs were determined by real-time PCR from RV or left ventricular (LV) tissues of control and PH calves. The relationship of mRNA abundance to mean PA pressure was determined by linear regression. ■, RV; □, LV. C: functional responses mediated by YAP-TAZ signaling. C: predicted functional responses mediated by YAP-TAZ signaling. Differentially expressed genes predicted to interact with YAP-TAZ were identified in the RV microarray dataset (Supplemental Table S2) and gene-ontology analysis of functional responses was performed with Ingenuity Pathway Analysis. The responses shown are filtered at z-score > 2, P < 0.05. Symbols are color coded according to major functional category as indicated (red, cell-cell signaling and interaction; orange, cell proliferation; green, cell movement).

