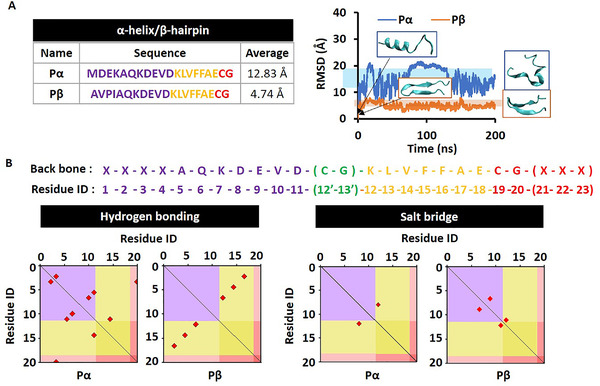
FIGURE 2.

Molecular stabilities and electrostatic interactions. (A) The root‐mean‐square deviation comparison of Pα versus Pβ. (B) The distribution landscapes of electrostatic interaction modes according to module division including hydrogen bond and salt‐bridge for Pα and Pβ
