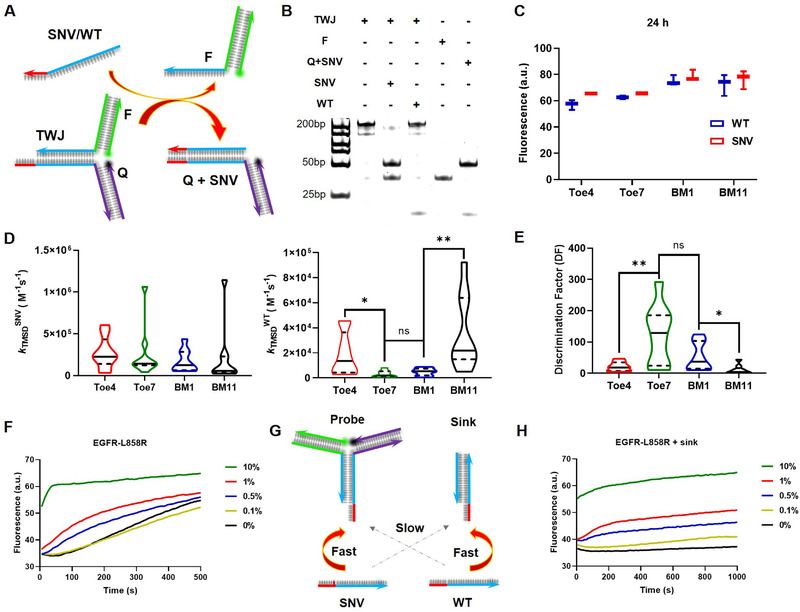
FIGURE 2.

Experimental verification of the results by simulation and VAF detection. (A) TWJ probe for SNV detection. The probes are fully complementary with SNV but forms single mismatch with WT. Each gene is adopted with four probes bearing mismatch at Toe4, Toe7, BM1, and BM11, respectively. (B) Verification of TMSD products by PAGE. Mismatch was located at Toe7. (C) Fluorescence intensities of the four TMSD probes after 24 h. (D) Experimental TMSD rate constants kTMSD of SNV and WT. (E) Discrimination factors for all tested genes. (*p < 0.05, **p < 0.01). In all violin charts of panel d and e, the horizontal solid line and dashed line represent the medians and quartiles. (F) Fluorescence curves of TMSD probes (Toe7 mismatch) in the presence of different percentages of SNV strands. (G) Scheme of probe‐sink system. The probe a TWJ structure is fully complementary with SNV and forms single mismatch with WT. The sink a linear TMSD structure is fully complementary with WT and forms single mismatch with SNV. (H) Fluorescence curves of probe‐sink systems (Toe7 mismatch) in the presence of different percentages of SNV strands
