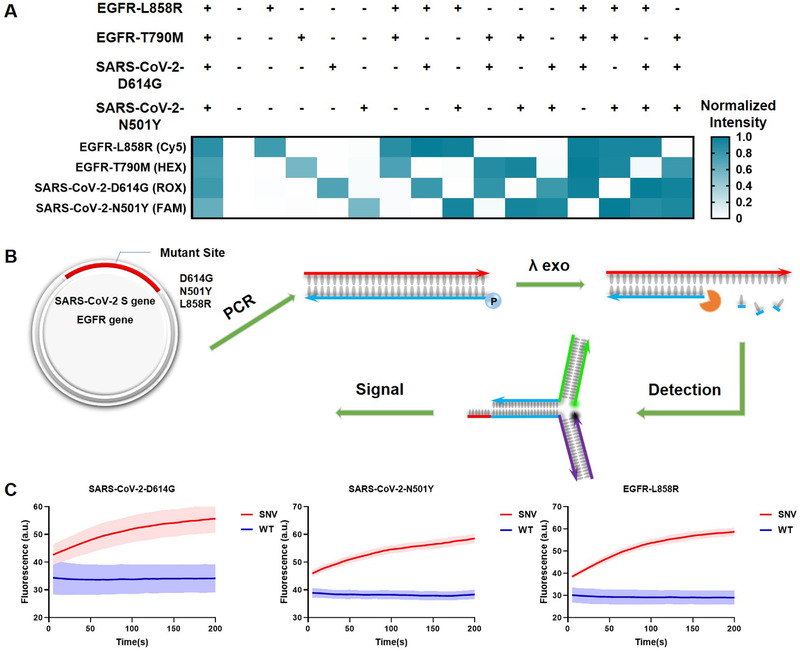
FIGURE 3.

Multiplexed detection and SNV detection in plasmid clones. (A) Results of multiplexed detection. 'Plus’ and ‘minus’ symbols represent the SNV and WT of the corresponding genes. The raw fluorescence curves are shown in Figure S13 in the Supporting Information. The fluorescence intensities of the products and reactants of TMSD reaction were normalized as ‘1′ and ‘0′ for each color. (B) Procedures for SNV detection in plasmid. Regions of interest are amplified by PCR, the 5′ end of the reverse primers are phosphorylated. λ Exo was used to generated single‐stranded DNA targets. (C) Fluorescence curves of SNV detection in PCR amplicons. All experiments were performed with three replicates
