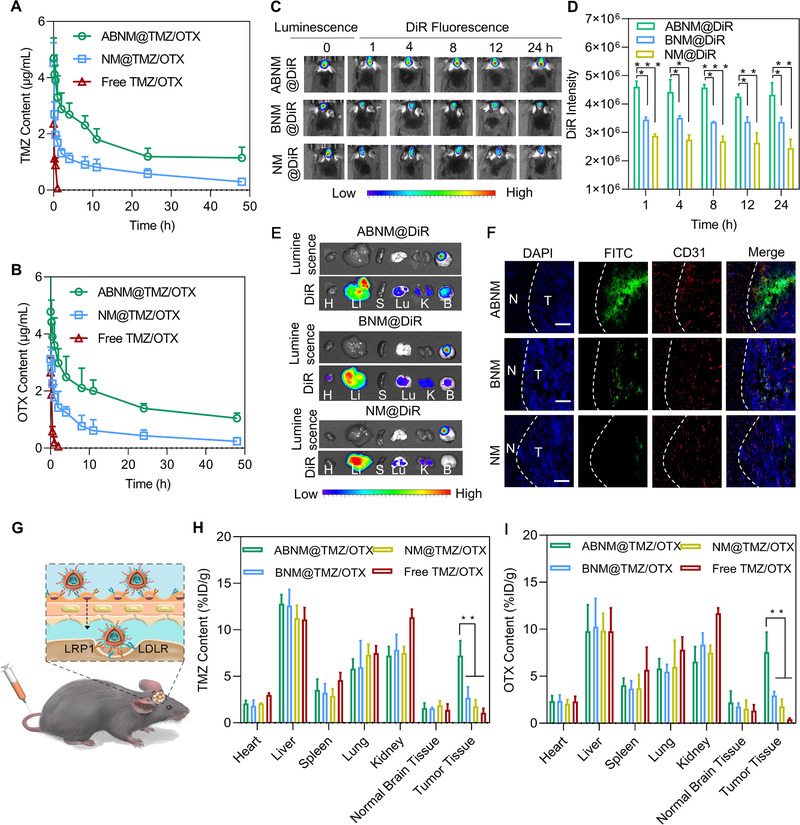
FIGURE 3.

Pharmacokinetics, in vivo imaging, BBB penetration, and biodistribution. Quantification of (A) TMZ and (B) OTX in mice receiving ABNM@TMZ/OTX, NM@TMZ/OTX or free TMZ/OTX (5 mg TMZ equiv./kg, 5 mg OTX equiv./kg) post administration. (C) In vivo fluorescence images and (D) DiR quantitative results of GL261‐Luc orthotopic mice at different time points after treatment with ABNM@DiR, BNM@DiR, or NM@DiR (1 mg DiR equiv. kg−1). (E) DiR fluorescence images of the major organs from C57BL/6 mice bearing orthotopic GL261‐Luc tumor 8 h after receiving ABNM@DiR, BNM@DiR, or NM@DiR (1 mg DiR equiv./kg). (F) Tumor penetration behavior of FITC‐labeled ABNM observed by CLSM. Dotted lines indicate tumor boundary. N: normal brain tissue, T: tumor tissue. The scale bars correspond to 50 μm. (G) Schematic illustration of BBB penetration by ABNM@TMZ/OTX via receptor mediated transcytosis. Quantification of (H) TMZ and (I) OTX distribution in major organs and tumor from C57BL/6 mice bearing orthotopic GL261‐Luc after i.v. injection of ABNM@TMZ/OTX, BNM@TMZ/OTX, NM@TMZ/OTX and free TMZ/OTX (5 mg TMZ equiv./kg, 5 mg OTX equiv./kg)
