
FIGURE 1.
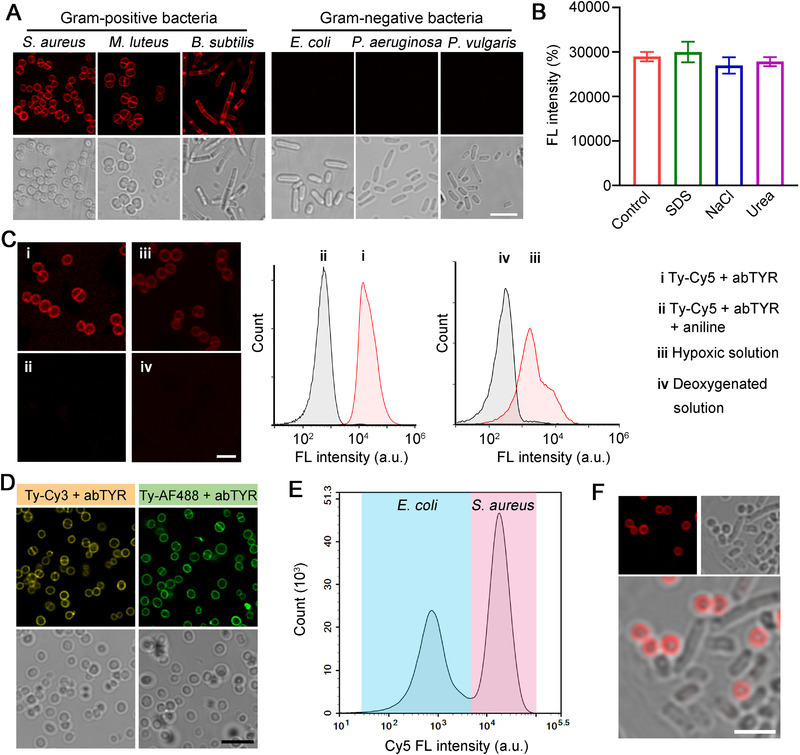
Selective fluorescence labeling of Gram‐positive bacterial cell walls. (A) Confocal images of different types of bacterial cells treated with abTYR (0.17 µM) and Ty‐Cy5 (1 µg mL−1) for 10 min. Before imaging, the bacteria were washed with phosphate‐buffered saline (PBS) for three times. Scale bar = 5 µm. (B) Fluorescence (FL) intensities of Cy5‐stained S. aureus bacterial cells (the bacterial number in each sample was the same) after being treated with PBS (control), 0.1% SDS, 0.5 M NaCl, and 50 mM urea solutions, respectively, as measured by flow cytometry. (C) Confocal images and flow cytometric results of S. aureus bacteria after different treatments as indicated. Aniline was used as a competitor to consume o‐quinone‐Cy5. The participation of oxygen in TyOCR was demonstrated by bacterial labeling in hypoxic and deoxygenated solutions. Scale bar = 2.5 µm. (D) Confocal images of S. aureus bacteria that were stained by Ty‐Cy3 (1 µg mL−1) or Ty‐AF488 (1 µg mL−1) in the presence of abTYR (0.17 µM). Before imaging, the bacteria were washed with PBS for three times. Scale bar = 5 µm. Flow cytometric result (E) and confocal fluorescence images (F) of a mixed suspension of E. coli and S. aureus, which was treated with Ty‐Cy5 (1 µg mL−1) and abTYR (0.17 µM) at room temperature for 10 min. Before measurements, the mixed suspension was washed with PBS for three times. Scale bar = 2.5 µm