
FIGURE 2.
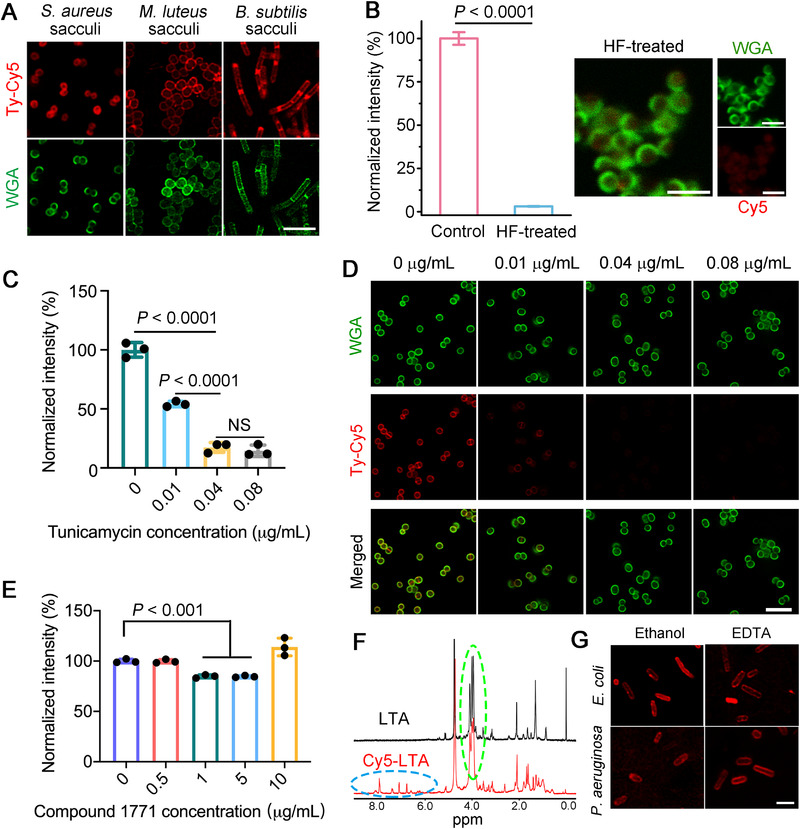
WTA is the major labeling site of TyOCR. (A) Confocal fluorescence images of different sacculi purified from their corresponding live bacterial cells labeled by Ty‐Cy5. Before imaging, the sacculi were stained by Alexa Fluor 488‐labeled wheat germ agglutinin (WGA‐AF488, 5 µg mL−1) to indicate cell wall structures. Scale bar = 5 µm. (B) Normalized fluorescence intensities and confocal fluorescence images of Ty‐Cy5‐labeled S. aureus sacculi with or without (control) the HF treatment. Before imaging, the sacculi were stained by WGA‐AF488 (5 µg mL−1). Scale bars = 2 µm. Statistical data were analyzed by unpaired Student's t‐test. Flow cytometric results (C) and confocal fluorescence images (D) showing the efficiencies of TyOCR‐based fluorescence labeling in S. aureus bacteria that were pretreated with different concentrations of tunicamycin. Statistical significance between the indicated groups was calculated using one‐way analysis of variance (ANOVA, "NS" stands for nonsignificant difference). Before imaging, the bacteria were first stained by Ty‐Cy5 (1 µg mL−1) in the presence of abTYR (0.17 µM) and then stained by WGA‐AF488 (5 µg mL−1), followed by PBS washing for three times. (E) Flow cytometric results of S. aureus bacteria that were pretreated with different concentrations of compound 1771 and then subjected to TyOCR labeling. Statistical significance between the indicated groups was calculated using one‐way ANOVA. (F) 1H NMR spectra of LTA and Cy5‐LTA. The green and blue dashed circles indicate the characteristic peaks of LTA and Cy5, respectively. (G) Confocal fluorescence images of ethanol/EDTA‐pretreated E. coli and P. aeruginosa bacteria after being stained by Ty‐Cy5 via the TyOCR‐based labeling method. Scale bar = 2.5 µm