
FIGURE 3.
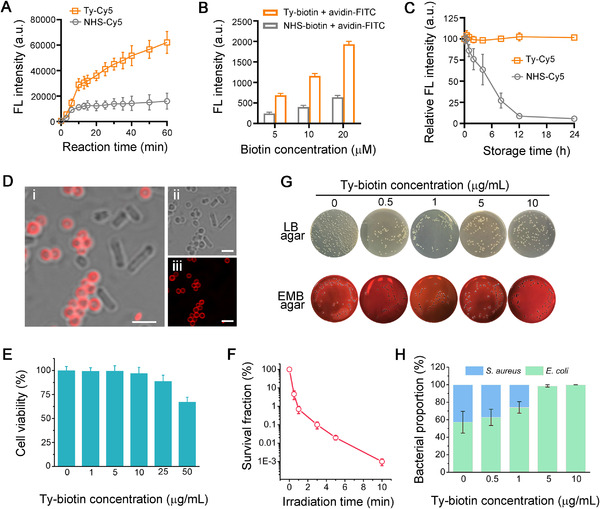
Comparison of different labeling strategies and photodynamic inactivation evaluations. (A) Fluorescence (FL) intensities of S. aureus bacteria that were reacted with Ty‐Cy5 (2 µM, in the presence of abTYR) or NHS‐Cy5 (2 µM) for different time periods, as measured by flow cytometry. (B) FL intensities of S. aureus bacteria that were first treated with different concentrations of Ty‐biotin (in the presence of abTYR) or NHS‐biotin for 20 min, washed with PBS, and further incubated with fluorescein isothiocyanate (FITC)‐labeled avidin (avidin‐FITC, 5 µg mL−1), as measured by flow cytometry. (C) Relative FL intensities of S. aureus bacteria stained by Ty‐Cy5 (2 µM, in the presence of abTYR) or NHS‐Cy5 (2 µM) for 20 min. Before staining, Ty‐Cy5 and NHS‐Cy5 were freshly dissolved in PBS (pH = 7.4) and stored at room temperature for different time periods as indicated. (D) Confocal images of a mixture of E. coli and S. aureus bacteria that were first treated with Ty‐biotin and abTYR and then incubated with avidin‐Ce6 (Ce6: 5 µg mL−1). Before imaging, the bacteria were washed with PBS three times. Panels (i)‒(iii) indicate merged, bright field, and fluorescence images, respectively. Scale bars = 2.5 µm. (E) Relative cell viabilities of S. aureus bacteria modified by different concentrations of Ty‐biotin via the abTYR‐mediated modification strategy. (F) Survival fractions of avidin‐Ce6‐modified S. aureus bacteria after being irradiated by white light (5 mW cm−2) for different time periods. (G) Representative photographs of LB and EMB agar plates after the photodynamic inactivation assays against S. aureus/E. coli mixtures, which were first pretreated with Ty‐biotin (0‒10 µg mL−1) and abTYR (0.17 µM), incubated with avidin‐Ce6 (Ce6: 5 µg mL−1), and irradiated by white light (5 mW cm−2) for 3 min. (H) Quantitative results showing the proportions of S. aureus and E. coli bacteria after different treatments as described in (G).