
FIGURE 4.
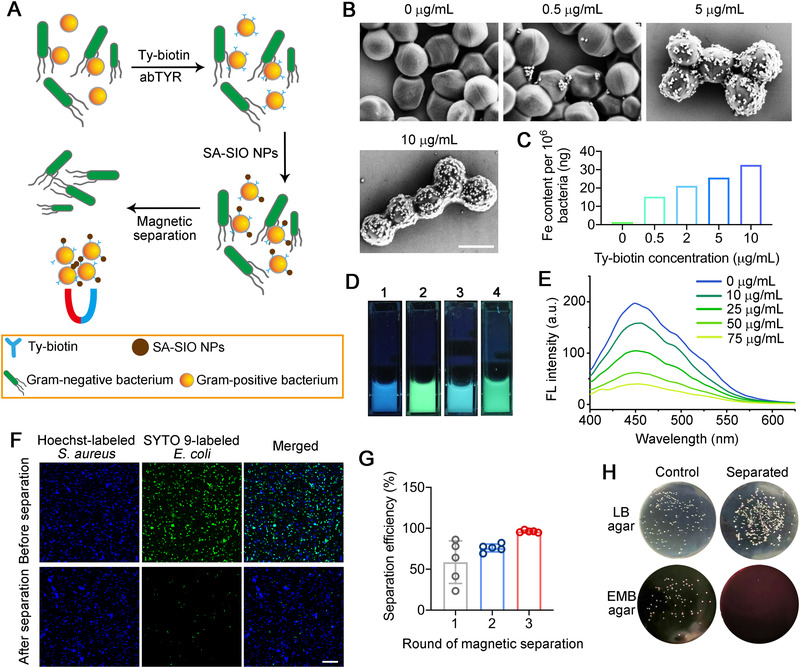
Magnetic isolation of Gram‐positive bacteria. (A) Schematic diagram illustrating the magnetic separation of Gram‐positive bacteria from Gram‐negative bacteria based on the TyOCR‐based modification strategy. (B) SEM images of S. aureus bacteria that were first treated with different concentrations of Ty‐biotin and abTYR (0.17 µM) and then labeled by SA‐SIO NPs (50 µg mL−1). Scale bar = 1 µm. (C) ICP‐MS results showing the Fe contents in SA‐SIO NP‐modified S. aureus bacteria that were prepared as described in (B). (D) Photographs of different bacterial suspensions under a UV lamp. To be specific, 1 is a Hoechst 33342‐stained S. aureus suspension; 2 is an SYTO 9‐stained E. coli suspension; 3 is a mixture of an equal volume of 1 and 2; 4 is the resultant suspension of 3 that was first treated with Ty‐biotin (10 µg mL−1) plus abTYR (0.17 µM), then incubated with 50 µg mL−1 SA‐SIO NPs, and finally subjected to magnetic separation. (E) Fluorescence emission spectra of Hoechst 33342 in 3 that was first treated with Ty‐biotin (10 µg mL−1) plus abTYR (0.17 µM), then labeled by different concentrations of SA‐SIO NPs (0−75 µg mL−1), and finally subjected to magnetic separation. (F) Confocal fluorescence images of 3 before and after the magnetic separation treatment. Scale bar = 25 µm. (G) Efficiencies of isolating S. aureus from a mixture of S. aureus and E. coli after different rounds of magnetic separation. (H) Representative photographs of LB and EMB plates spread with mixed S. aureus/E. coli suspensions that were pretreated with or without (control) three rounds of magnetic separation