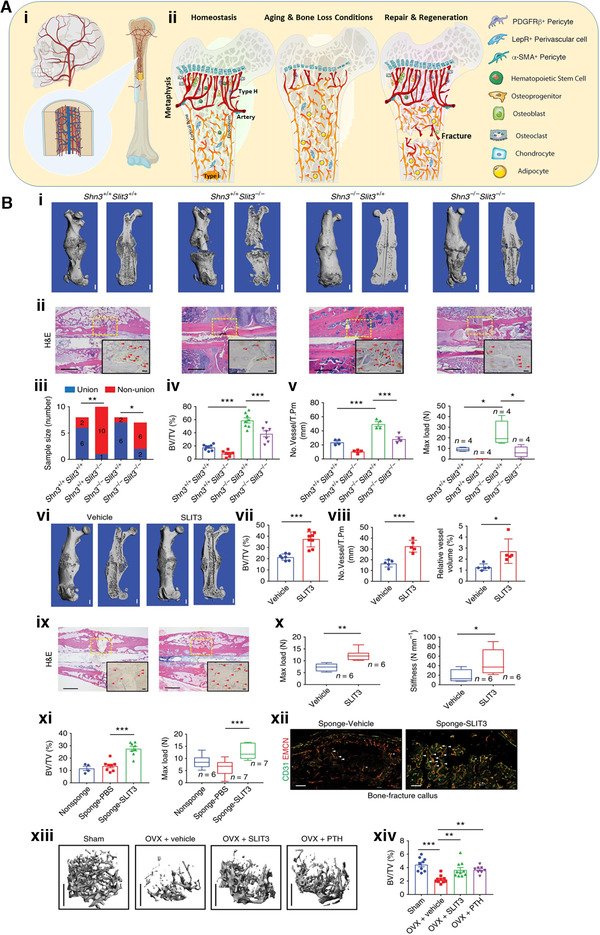
FIGURE 5.

Targeting skeletal endothelium to ameliorate bone loss. (A) (i) The vasculature is widely distributed in the skeleton. (ii) Type H vessels are the primary factor regulating and maintaining perivascular osteoprogenitors and promoting angiogenesis. They are rich in young people (left) and traumatic sites in bone (right), but much less frequent among the elderly (middle). (ii) Reprinted with permission.[ 67 ] (B) Administration of recombinant SLIT3 has a salutary influence on bone fracture healing, as well as OVX‐induced bone loss in mouse femur. (i) Representative micro‐CT (ii) Representative H&E staining and endomucin (EMCN) immunohistochemistry (IHC) images 3 weeks after open fracture in the midshaft. The boxes represent the fracture site. Arrowheads highlight EMCN‐positive vessels. (iii–v) Non‐union frequency, micro‐CT analysis of BV/TV in callus region. (iv) Shn3+/+ Slit3+/+, Shn3+/+ Slit3−/−, Shn3−/− Slit3+/+, and Shn3−/− Slit3−/−, EMCN‐positive vessel numbers (v, left) and maximum compressive loading (v, right) of the fractured femora 28 days after open midshaft fracture in femur. (vi,vii) Representative micro‐CT (vi) H&E staining (vii) and EMCN IHC images of mouse femurs 3 weeks after fracturing with i.v. injection of SLIT3 or PBS. (viii–x) Micro‐CT measurement of BV/TV in callus area, EMCN‐positive vessel number and volume (ix), and maximum compressive load and stiffness (x) of femurs 3 weeks post‐fracture with i.v. injection of SLIT3 or PBS. (xi) Test of fracture callus BV/TV (left) and maximum loading (right) of mouse femurs excised 3 weeks after fracturing with insertion of a gelatin sponge soaked with SLIT3 or vehicle. (xii) Representative confocal images of CD31 (green) and EMCN (red) dual‐immunostained callus sections of mouse femurs 3 weeks after fracturing with insertion of a gelatin sponge soaked with SLIT3 or vehicle (high power, insert). Arrowheads highlight CD31hiEMCNhi vessels. (xiii,xiv) Representative μCT images of the trabecular bone in the distal femur (xiii) and relative BV/TV. Values represent mean ± s.e.m. Reproduced with permission.[ 68 ] Copyright 2018, Springer Nature
