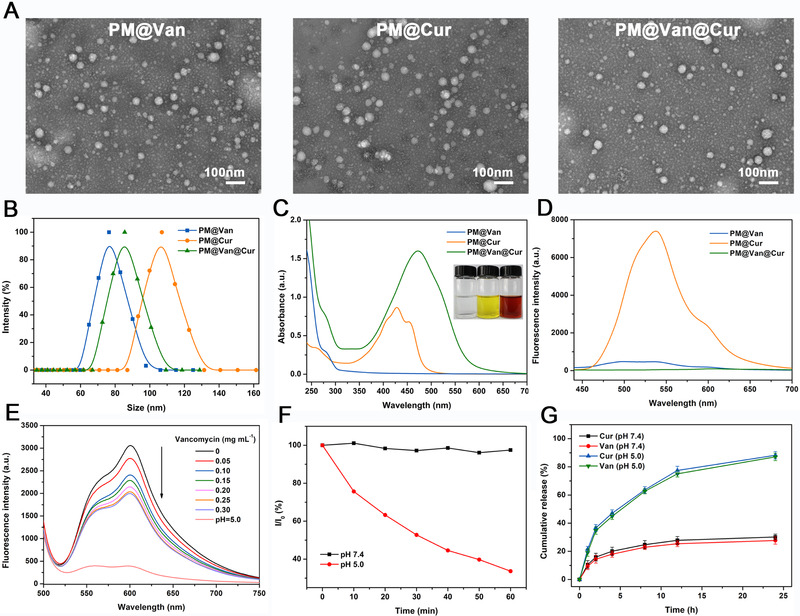
FIGURE 1.

Characterization of dynamic covalent polymeric antimicrobials. (A) TEM images, (B) size distributions, (C) UV–vis absorption spectra, and (D) fluorescence spectra of different PM@Van, PM@Cur, and PM@Van@Cur. (E) Fluorescence spectra of mixture solution consisting of ARS and PEG‐b‐P(Lys‐co‐LysPBA) under different amounts of vancomycin titration and pH 5.0. (F) Relative light scattering intensity variation of the PM@Van@Cur solutions at different pH values. (G) In vitro release profiles of vancomycin and curcumin from PM@Van@Cur at different pH conditions
