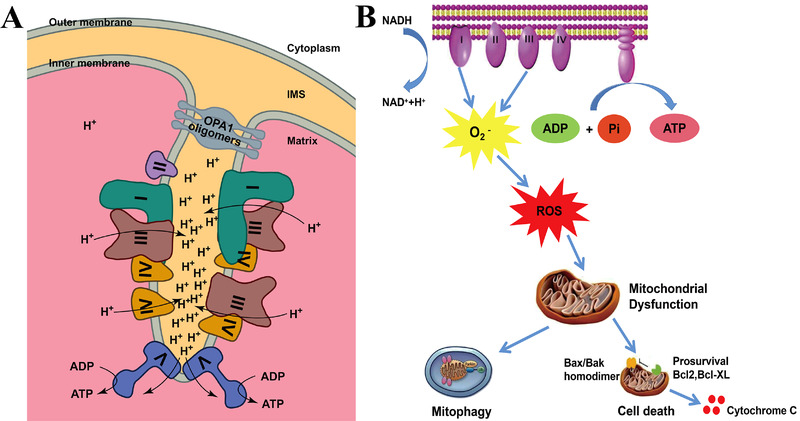
FIGURE 1.

Schematic illustration of mitochondrial ETC and mitochondrial dysfunction. (A) Simple cartoon model of ETC on the IMM. Reproduced with permission.[ 43 ] Copyright © 2017 Chang Gung University. Publishing services by Elsevier B.V. (B) Electron leakage from ETC induces superoxide ions, generates excessive ROS, and causes mitochondria damage as well as subsequent events. Reproduced with permission.[ 42 ] Copyright © 2019 Wiley Periodicals, Inc.
