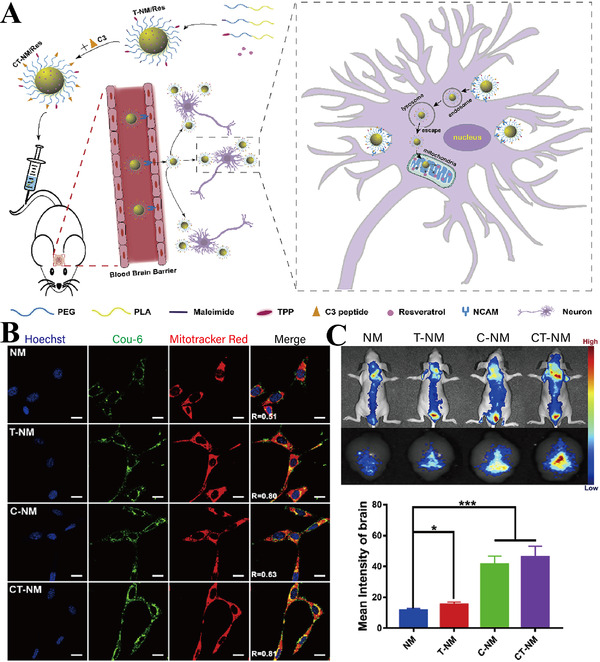
FIGURE 5.

(A) Schematic illustration of the targeting ability and therapeutic function of micelles. (B) Co‐localization imaging of different Cou‐6‐loaded NPs group (green) with mitochondria (red) and nuclei of Neuro‐2a cells (blue) (scale bar = 10 μm). R denotes the overlap ratio. (C) Representative in vivo imaging (left), and statistics data (right) of brain mean fluorescence intensity 1 h post injection with different DiR‐loaded NPs. *p < 0.05, ***p < 0.001. Reproduced with permission.[ 109 ] Copyright © 2020 Elsevier Ltd. All rights reserved
