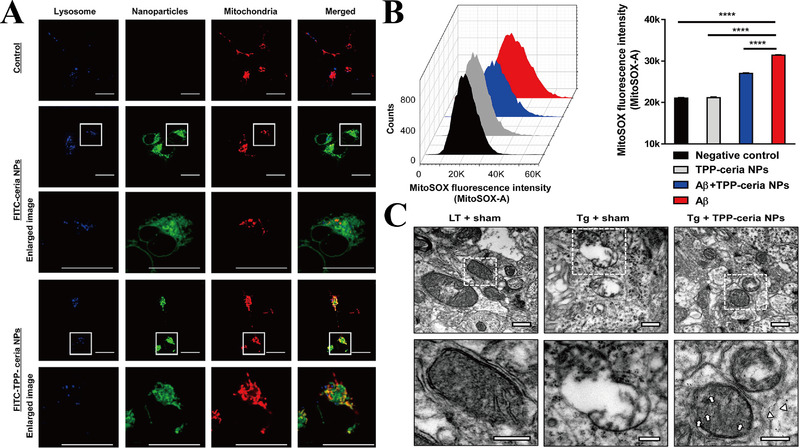
FIGURE 7.

(A) Co‐localization images of mitochondria (red) with FITC‐ceria NPs/TPP‐ceria NPs (green) and lysosome (blue) (scale bar = 20 μm). Enlarged box area are shown below each image. (B) The representative images and statistic data of MitoSOX intensity in cell line. ****p < 0.0001. (C) TEM images of mitochondria morphologies (scale bar = 500 nm). Enlarged box area is shown below each image. Arrows: NPs in mitochondrial matrix; arrowheads: NPs in mitochondrial cytosol (scale bar = 250 nm). LT: littermate mice; Tg: 5 × FAD mice. Reproduced with permission.[ 32 ] Copyright © 2016 American Chemical Society
