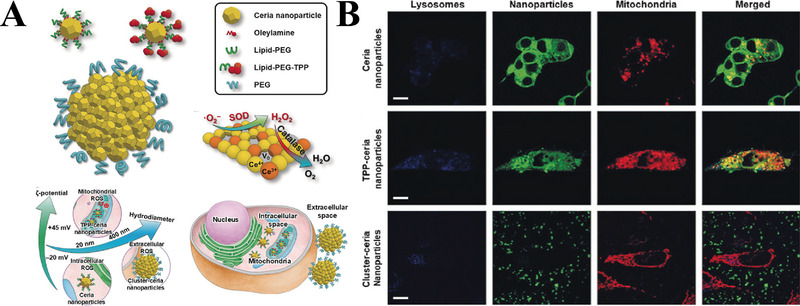
FIGURE 8.

(A) Schematic illustration of the design and function of Cluster‐ceria NPs, TPP‐ceria NPs, and Ceria NPs. (B) Co‐localization images of different FITC‐NPs (green) with mitochondria (red) and lysosome (blue) (scale bar = 10 μm). Reproduced with permission.[ 127 ] Copyright © 2018 Wiley‐VCH Verlag GmbH & Co. KGaA, Weinheim
