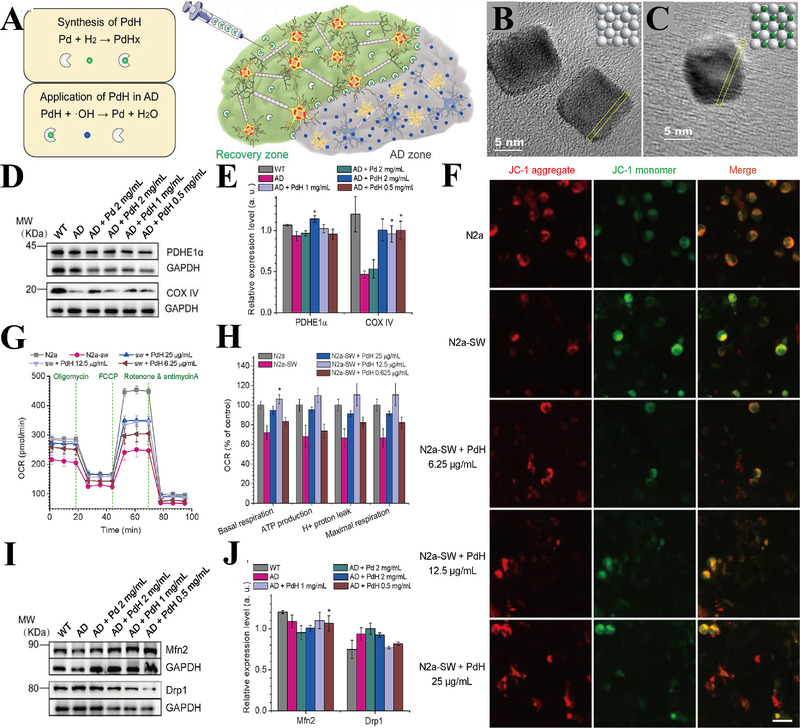
FIGURE 9.

(A) Schematic illustration of synthesis and application of PdH NPs in AD treatment. (B,C) TEM images of PdH and Pd NPs. (D) Representative images and (E) statistic data of metabolism‐related proteins (PDHE1α and COX IV) expression in mice hippocampus. (F) Mitochondrial membrane potential of N2a (control cell line), N2a‐SW (AD model cell line), and N2a‐SW+different concentrations of PdH NPs measured by JC‐1 (scale bar = 20 μm). (G) Representative line graph and (H) statistic data of OCR (cell oxygen consumption rate), including ATP production, maximal respiration, H+ proton leak, and basal respiration. (I) Immunoblots pattern and (J) statistic data of mitochondrial fission/fusion proteins Mfn2/Drp1 expression in mice hippocampus. *p < 0.05. Reproduced with permission.[ 33 ] Copyright © 2019 Elsevier Ltd. All rights reserved
