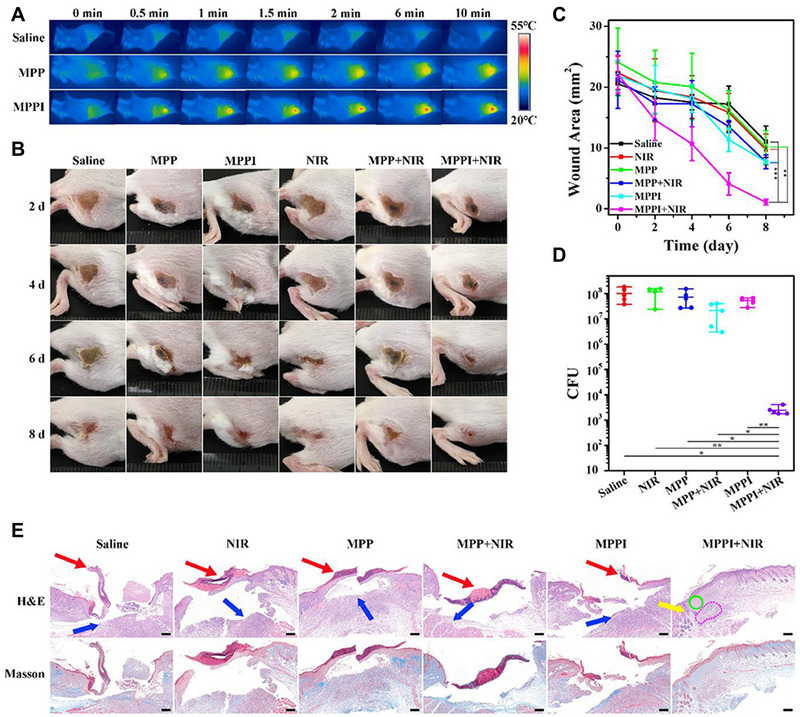
FIGURE 7.

(A) IR thermal images of S. aureus infected tissues after different treatments. (B) Digital images of S. aureus infected tissues after treatment. (C) Variation of wound area after different treatments. (D) Colony‐forming units (CFU) of S. aureus in infected tissues 8 days post‐treatment. (E) Hematoxylin and eosin and Masson's trichrome staining of S. aureus infected tissues after treatment. Reproduced with permission from.[ 124 ] Copyright 2019, Frontiers Media SA
