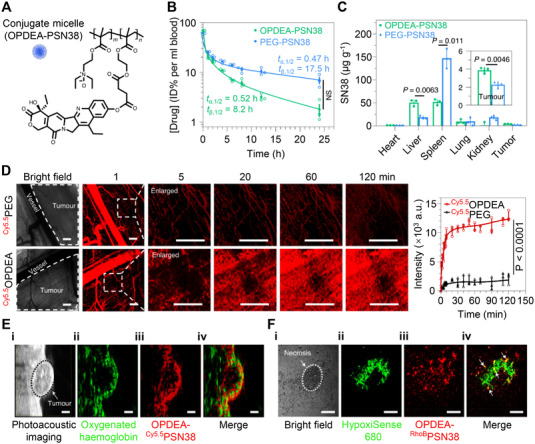
FIGURE 2.

Zwitterionic OPDEA‐PSN38‐based micelle for efficient cancer drug delivery. (A) Molecular structure of OPDEA‐PSN38, which can form micelles in aqueous solution. Blood clearance (B) and biodistribution (C) of OPDEA‐PSN38 and PEG‐PSN38 micelles in HepG2 tumor‐bearing mice. The content of SN38 was analyzed 8 h after intravenous injection (SN38‐equivalent dose, 10 mg kg−1). (D) In vivo fluorescence imaging showing the extravasation of OPDEA or PEG from tumor blood vessels into tumor tissue in a subcutaneous 4T1 tumor after intravenous administration. Both polymers were labeled with Cy5.5 (red) (Cy5.5‐equivalent dose, 0.5 mg kg−1). The left pictures show representative and enlarged images of a randomly selected location (white dashed frame), and the right panel shows the overall fluorescence intensity of the selected area. Scale bars, 500 μm. (E) In vivo ultrasound and photoacoustic images showing the distribution of OPDEA‐Cy5.5PSN38 micelles inside a HepG2 tumor (Cy5.5‐equivalent dose, 0.5 mg kg−1). (i) Ultrasound image of the tumor; (ii) photoacoustic image of the oxygenated hemoglobin used to outline the hypoxic area in the tumor (green); (iii) fluorescent image of the micelles (red) in the tumor; (iv) overlapped image of oxygenated hemoglobin and the micelles. Scale bars, 1.0 mm. (F) Ex vivo CLSM images showing the distribution of circulated RhoB‐labeled OPDEA‐PSN38 micelles in hypoxic tumor regions at 6 h. The tumor received a RhoB‐equivalent dose of 0.5 mg kg−1. The hypoxic regions in a tumor were stained with HypoxiSense 680. (i) A necrotic region marked by a white dashed line; (ii) HypoxiSense 680 (green); (iii) OPDEA‐RhoBPSN38 (red); (iv) overlapped image, white arrows indicate colocalization (yellow dots). Scale bars, 100 μm. Reproduced with permission.[ 27 ] Copyright 2021, Springer Nature.
