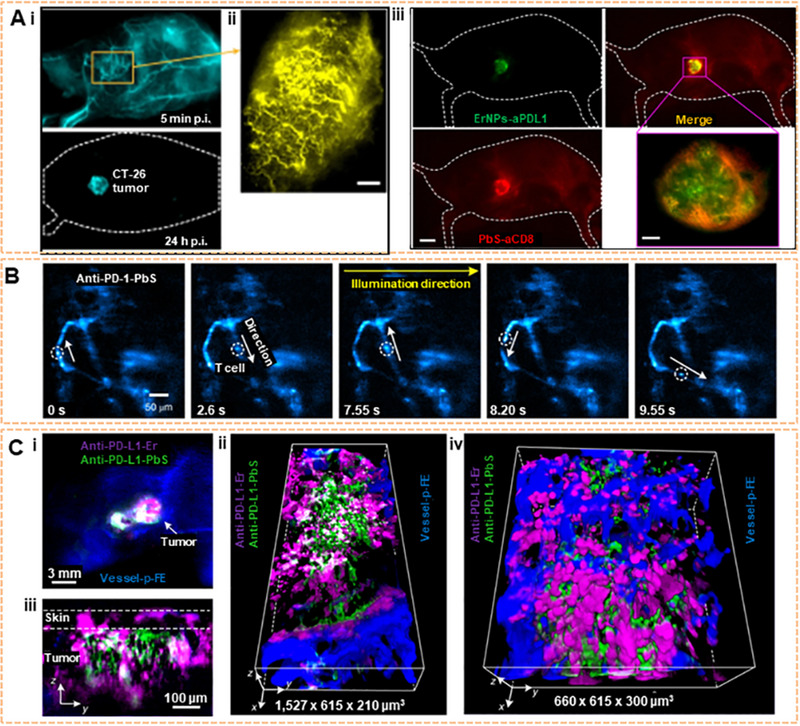
FIGURE 10.

NIR‐II imaging for immunotherapy. (A) In the left margin, the wide‐field image of a CT‐26 tumor mouse injected with Er NPs‐1/10th that PD‐L1 containing 20 μg anti‐PD‐L1 mAb (1 mg kg−1); High‐magnification molecular imaging of the CT‐26 tumor at 5 min post‐injection of Er NPs‐1/10th a PD‐L1 (scale bar, 500 μm). In the right margin, the different heterogeneous signal distributions of PbS‐aCD8 and ErNPs‐aPDL1. Dual molecular imaging (upper right) of a CT‐26 tumor mouse injected with mixed ErNPs‐aPDL1 (green color, upper left) and PbS‐aCD8 (red color, lower left). Reproduced with permission.[ 207 ] Copyright 2019, Springer Nature. (B) Time‐course recording of PD‐1+cells (white circles) in a CT26 tumor labeled by anti‐PD‐1 CSQDs at 20 frames per second by oblique LSM (excitation: 1319 nm; emission: 1500–1700 nm). Reproduced with permission.[ 208 ] Copyright 2019, Springer Nature. (C) Wide‐field imaging of cells labeled with anti‐PD‐L1 ErNP (magenta), anti‐PD‐1 PEGylated PbS/CdS CSQD (green), and p‐FE filling vessels (blue) in a CT26 tumor (upper left). Reproduced with permission.[ 208 ] Copyright 2019, Springer Nature.
