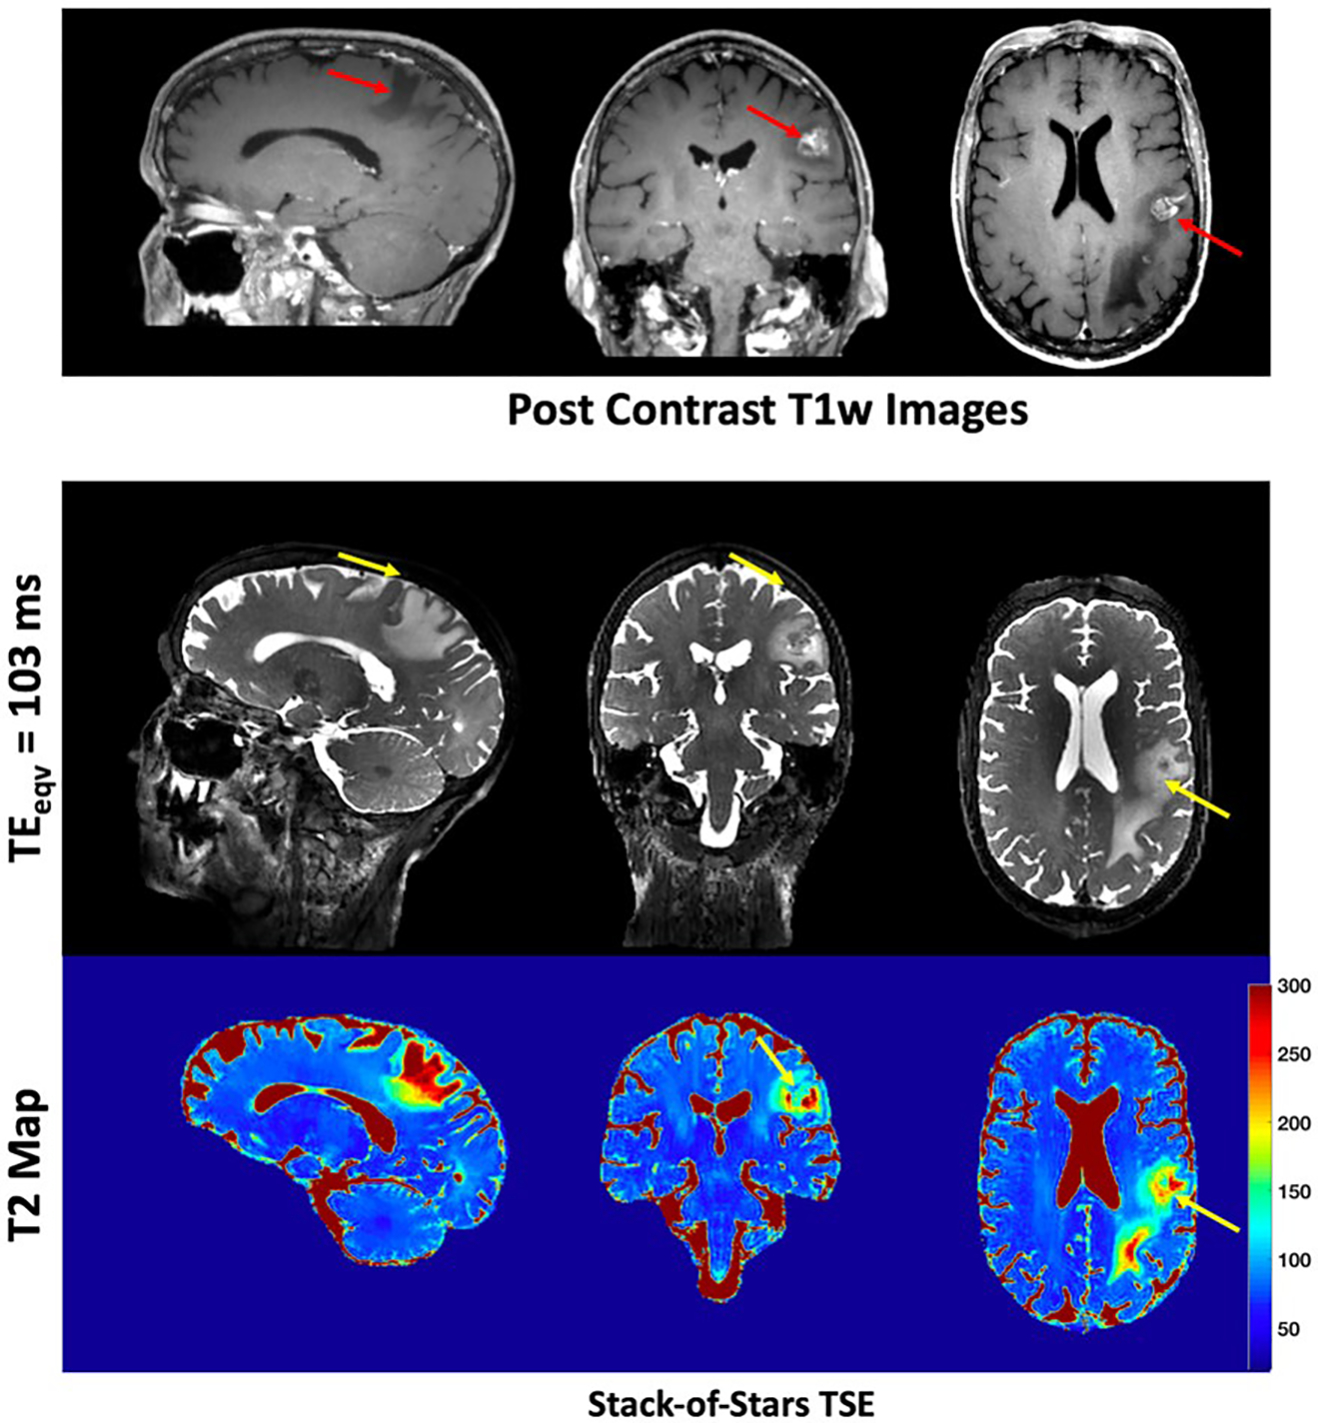
FIGURE 7.

T2w images from precontrast stack-of-stars TSE are shown for a patient with brain metastasis. Also shown are the post contrast T1w Cartesian SPACE images that show the enhancing lesions (red arrows) along with the region of edema. The metastatic lesion has hyperintense T2 signal, corresponding to high T2 values, as demonstrated in the precontrast stack-of-stars TSE images and maps
