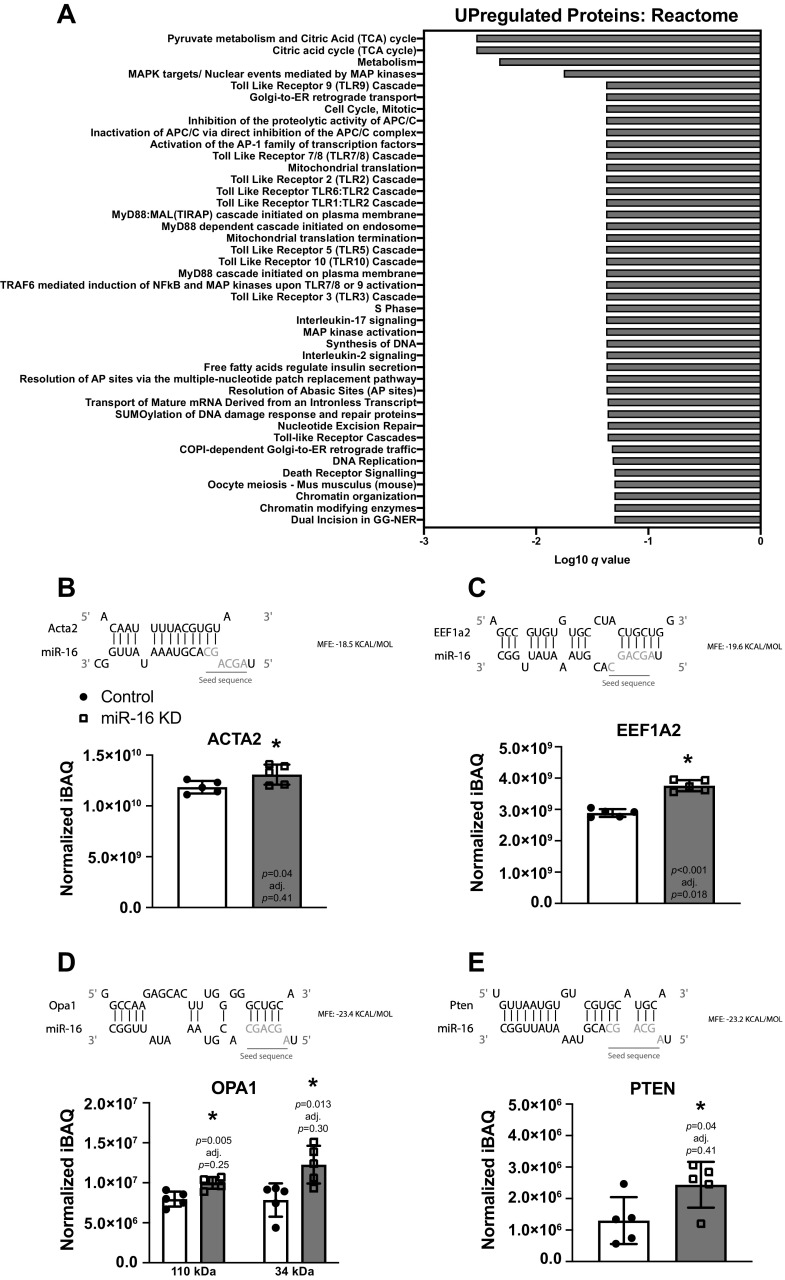
Figure 2.
Proteomic analysis in proliferating C2C12 myoblasts 18 h after miR-16 knockdown (KD). A: Reactome pathway analysis using upregulated differentially expressed proteins (P < 0.05). B–E: thermodynamic and seed sequence target prediction for miR-16 and protein levels of ACTA2 (B), EEF1A2 (C), OPA1 (D), and PTEN (E) in control and KD myoblasts. iBAQ, intensity-based absolute quantification. For all experiments, n = 5 technical replicates were utilized. *P < 0.05. Created with BioRender.com.

