Abstract
The immune checkpoint receptor Lymphocyte activation gene-3 (LAG3) inhibits T cell function upon binding to Major Histocompatibility Complex Class II (MHCII) or Fibrinogen-like 1 (FGL1). Despite the emergence of LAG3 as a target for next-generation immunotherapies, we have little information describing the molecular structure of the LAG3 protein or how it engages cellular ligands. Here, we determined structures of human and murine LAG3 ectodomains, revealing a dimeric assembly mediated by immunoglobulin domain 2 (D2). Epitope mapping indicates that a potent LAG3 antagonist antibody blocks interactions with MHCII and FGL1 by binding to a flexible “Loop 2” region in LAG3 domain 1 (D1). We also defined the LAG3:FGL1 interface by mapping mutations onto structures of LAG3 and FGL1, and we established that FGL1 crosslinking induces the formation of higher-order LAG3 oligomers. These insights will guide LAG3-based drug development and implicate ligand-mediated LAG3 clustering as a mechanism for disrupting T cell activation.
INTRODUCTION
The cancer immunotherapy revolution was inspired by the success of antibodies targeting the immune checkpoint receptors Programmed cell death protein 1 (PD-1) and CTLA41-3. Following PD-1 and CTLA4, Lymphocyte-activation gene 3 (LAG3) was the next immune checkpoint to be targeted in the clinic4-6. The LAG3 receptor negatively regulates effector T cell function and synergizes with PD-1 to mediate T cell exhaustion7-10. Several LAG3 antagonist antibodies are currently under clinical evaluation as cancer immunotherapies, either as single-agents or in combination with inhibitors of checkpoints such as PD-111-13, TIGIT14 and TIM-311. In a recent breakthrough, combination therapy with the LAG3 antibody Relatlimab and the PD-1 antibody Nivolumab led to a statistically significant improvement in progression-free survival of advanced melanoma patients compared to Nivolumab alone, thereby validating LAG3 as a next-generation immunotherapy target15. Emerging data also suggest that LAG3 agonism may have therapeutic potential in the treatment of autoimmune disease16. LAG3 expression is associated with reduced disease severity in models of graft-versus-host disease (GVHD) and multiple sclerosis17, and a LAG3 agonist antibody was shown to induce immunosuppressive effects in a primate model for antigen-specific delayed-type hypersensitivity18.
LAG3 was initially classified as a paralog of the T cell co-receptor CD4 based on sequence conservation (~20% amino acid identity) and because both proteins bind to Major Histocompatibility Complex II (MHCII)19. The LAG3 and CD4 proteins also have similar domain architectures, with each containing four extracellular immunoglobulin (Ig) domains (D1-D4) followed by a connecting peptide, transmembrane domain, and intracellular domain (ICD). Despite these biochemical similarities, LAG3 and CD4 exert opposing effects on T cell function20,21. When a T cell receptor (TCR) and CD4 bind MHCII, CD4 potentiates T cell activation by recruiting Lck kinases that phosphorylate components of the TCR complex20. By contrast, LAG3 negatively regulates T cells by inhibiting CD3-mediated calcium flux and nuclear factor of activated T cells (NFAT) activation22,23. This inhibitory effect is mediated by an undefined mechanism that requires three cryptic motifs in the LAG3 ICD: a membrane-proximal ‘FXXL’ motif, a central ‘KIEELE’ motif, and a C-terminal EP repeat24,25.
Multiple ligands may engage the extracellular domain (ECD) of LAG3 to stimulate its immunosuppressive function. MHCII was the first cellular binding partner identified for LAG3, and intercellular adhesion studies indicated that LAG3 binds to MHCII with higher affinity than CD426,27. Based on this observation, it was hypothesized that LAG3 inhibits T cell activation by competing for the CD4 binding site on MHCII. However, double-staining experiments revealed that the LAG3 and CD4 engage MHCII at distinct, non-overlapping sites28. Interactions between LAG3 and MHCII are primarily mediated by a ~30 amino acid insertion loop (Ala74 - Arg98) in LAG3 D128,29. Furthermore, it was recently demonstrated that the stability of the antigenic peptide bound by MHCII may influence LAG3-binding affinity28, and that LAG3 does not interfere with TCR:MHCII or CD4:MHCII binding28, suggesting that LAG3 function does not depend on steric blockade of canonical T cell-activating interactions30.
The secreted factor Fibrinogen-like 1 (FGL1) is also a major ligand for LAG331. FGL1 proteins are comprised of an N-terminal coiled-coil (CC) domain that mediates oligomerization and a C-terminal fibrinogen-like domain (FD). Direct interactions between the FD of FGL1 and the D1-D2 region of LAG3 suppress T cell activation31. Under physiological conditions, FGL1 is expressed by hepatocytes and may contribute to the immune-privileged state of the liver31. Secretion of FGL1 is increased in certain cancers, including melanoma and non-small cell lung cancer (NSCLC), and blockade of LAG3:FGL1 interactions inhibits tumor growth in animal models31. Besides FGL1, other putative LAG3 binding partners include LSECtin32, Galectin-333, and α-synuclein34,35, and APLP136.
Despite the emergence of LAG3 as an important regulator of T cell immunity, we have a poor understanding of structure-function relationships between the LAG3 ECD, ligands, and antibodies. To gain insight into LAG3 molecular function, we determined crystal structures of the human and murine LAG3 ECDs and the LAG3-binding domain of FGL1. We then mapped the binding sites of FGL1, MHCII, and two LAG3-neutralizing antibodies on to the LAG3 structures. We found that an antibody to a D1 loop blocked MHCII and FGL1 binding and inhibited LAG3 suppressive function more potently than a D4-specific antibody. On the FGL1 side, we mapped the LAG3 binding site to flexible loops in the FD domain of FGL1 and determined that FGL1-medatiated crosslinking induces the formation of LAG3 clusters on the T cell surface. Collectively, our data fills several gaps in our knowledge of LAG3 molecular architecture and ligand-engagement and will inform the development of optimal LAG3-targeting antibodies.
RESULTS
Engineering a crystallizable variant of LAG3.
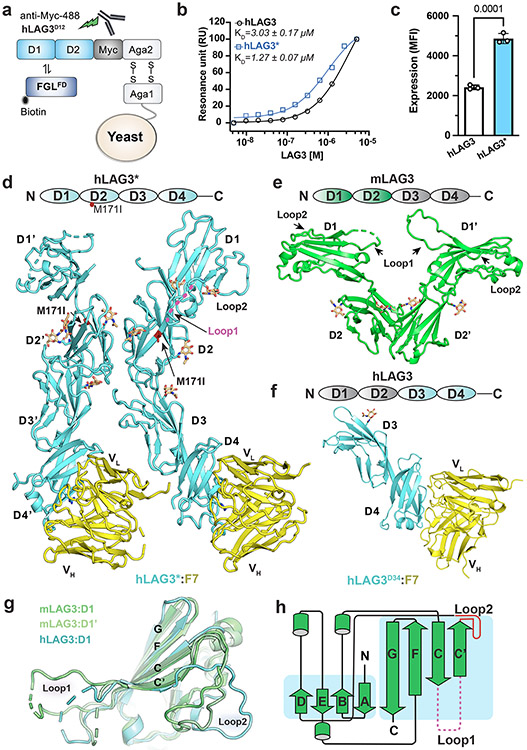
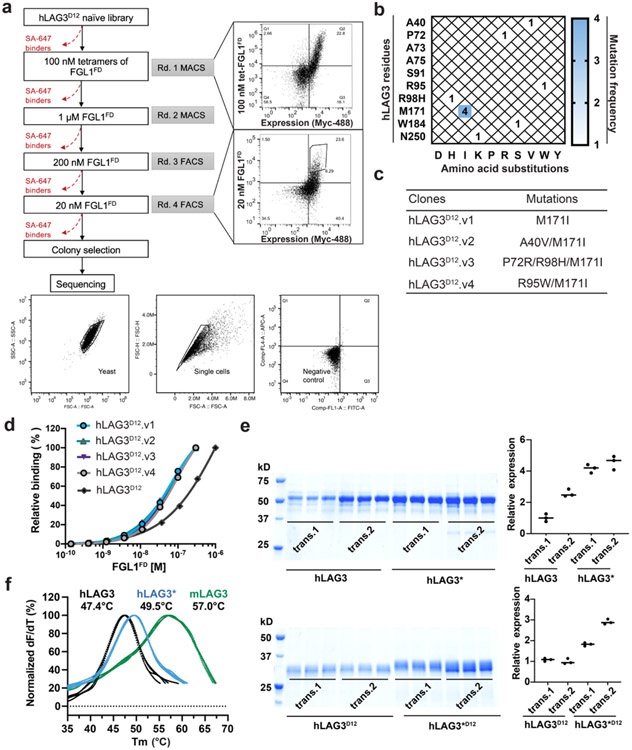
Our initial attempts to determine the structure of LAG3 were confounded by the low yields and poor crystallizability of the recombinant human LAG3 ECD (hLAG3). To solve this problem, we used yeast display to select for LAG3 variants with improved biochemical properties, such as increased expression and ligand-binding affinity (Fig. 1a, Extended Data Fig. 1a). Following the selections, sequencing of individual clones revealed a recurring M171I substitution in LAG3 D2 (Extended Data Fig. 1b) that was present as a single mutant (clone hLAG3D12.v1) or in combination with the following mutations in LAG3 D1: A40V (clone hLAG3D12.v2), P72R and R98H (clone hLAG3D12.v3), or R95W (clone hLAG3D12.v4) (Extended Data Fig. 1c). Titration of the four LAG3 clones with increasing concentrations of the FGL1 FD (FGL1FD) revealed that all four variants had similar FGL1-binding affinities, indicating that the M171I mutation was sufficient to confer enhanced binding to LAG3 (Extended Data Fig. 1d). Henceforth, we refer to the full human LAG3 ECD as hLAG3 and the human LAG3 ECD containing a single M171 mutation as hLAG3*.
Figure 1. Structures of human and murine LAG3 ECDs.
a, Cartoon schematic of the hLAG3D12 yeast display construct used to generate a mutant library. Biotinylated FGL1FD and an anti-Myc antibody were used to select for binders with increased ligand binding affinity and surface expression, respectively. b, Steady state SPR binding isotherms were fitted to determine the binding affinities between FGL1FD and hLAG3 or the hLAG3* variant. The average KD and standard deviation of two replicates are presented. c, Cell surface expression level of hLAG3 or hLAG3* as determined by flow cytometry. Data represent the mean MFI ± SD from n=3 independent biological replicates and statistics determined by using one-way analysis of variance (ANOVA) with P values noted in the figure. d, Crystal structure of hLAG3* bound to the scFv of F7. Unmodeled residues are shown as dashed lines. hLAG3: cyan; F7: yellow; M171I: red. mLAG3: green. Loop 1 of hLAG3: magenta. e, Crystal structure of mLAG3D12. f, Crystal structure of hLAG3D34 bound to F7. g, Structural alignment of mLAG3 D1, and hLAG3 D1. The Loop 2 region between the C’ and D strands adopts distinct conformations in each domain. h, Topology diagram of D1 from the mLAG3 structure.
The hLAG3* protein bound to FGL1 with 2.9-fold higher affinity (KD 1.1 μM) than hLAG3 (KD 3.2 μM) in a surface plasmon resonance (SPR) assay (Fig. 1b). Additionally, hLAG3* was displayed at 2-fold higher levels than WT LAG3 on the surface of yeast (Fig. 1c) and the yield of insect cell-expressed recombinant hLAG3* was increased by 2- to 3-fold compared to hLAG3, depending on the length of the construct (Extended Data Fig. 1e). We used differential scanning fluorimetry (DSF) to determine that hLAG3 and hLAG3* had melting temperatures of 47.4 °C and 49.5 °C (Extended Data Fig. 1f), respectively, indicating that the M171I mutation was more thermostable than WT LAG3. Based on the favorable biochemical properties conferred by the M171I mutation, we chose to conduct subsequent structural studies using the hLAG3* variant.
Crystal structures of human and murine LAG3 ECDs.
Crystals of hLAG3* bound to an antagonist single-chain variable fragment (scFv) diffracted to 3.7 Å resolution (Fig. 1d, Extended Data Fig. 2a and Supplementary Table 1). The scFv of F7, functioned as a crystallization chaperone and provided preliminary phase information as a molecular replacement model37. We also determined the 2.1 Å resolution structure of murine LAG3 domains 1 and 2 (mLAG3D12, Fig. 1e and Supplementary Table 1) and the 2.4 Å resolution structure of human LAG3 domains 3 and 4 (hLAG3D34, 2.4 Å resolution) bound to F7 (Fig. 1f and Supplementary Table 1). These high-resolution models provided detailed structural information and helped facilitate model building in the lower-resolution electron density map of the hLAG3*:F7 structure.
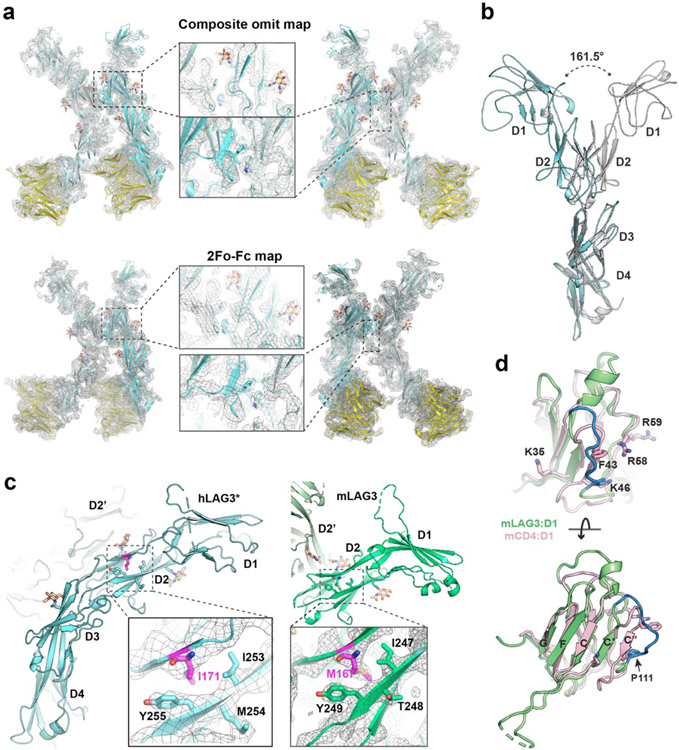
In the hLAG3*:F7 complex, the four Ig-like domains of hLAG3* adopt a curved, elongated arrangement (Fig. 1d). D1 and D2 fold as discrete domains, whereas Ig domains 3 and 4 (D3, D4) form a contiguous unit connected by an extended beta strand. The hLAG3* M171I mutation is located on a β strand in the D2 domain (Extended Data Fig. 2c) and may enhance LAG3 stability by improving hydrophobic packing with the surrounding Y255 and I253 residues in the β sheet (Extended Data Fig. 2c)38,39. There were two copies of the hLAG3*:F7 complex in the asymmetric unit. Alignment of the D3-D4 domains of the two hLAG3* protomers suggests that the D2-D3 linker is highly flexible, as D2 is rotated by 161° relative to D2 in the second protomer (Extended Data Fig. 2b). In one hLAG3* protomer, LAG3 D1 was only partially modeled due to weak electron density (Extended Data Fig. 2a). The more ordered copy of D1 was fully modeled except for an insertion (Loop 1) spanning from residues Ala74 to Arg98 that has been implicated in MHCII binding (Fig. 1d).
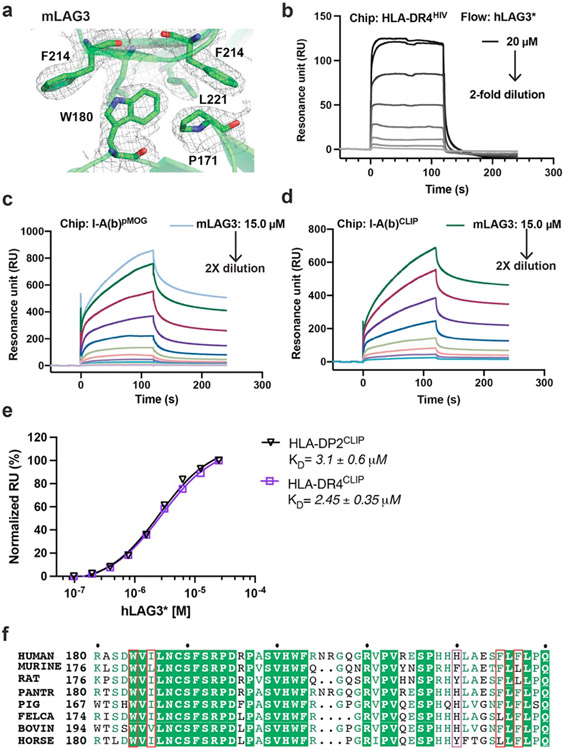
Crystals of mLAG3D12 contained two protomers in the asymmetric unit (Fig. 1e). Alignment of D1 from hLAG3* and each copy of D1 from the mLAG3D12 structure revealed that Loop 1 was oriented differently in each domain (Fig. 1g). In the higher-resolution structure of mLAG3, Loop 1 could be more completely built and only lacks the residues Gly70 to Ser86 (Fig. 1e). We also observed a second “Loop 2” between the C’ and D strands of D1 (Gly107 to Pro115 in hLAG3, Gly103 to Pro111 in mLAG3) that adopts distinct conformations in each protomer (Fig. 1g). In the homologous V-set Ig-like domains, such as the D1 domain of CD4 (Extended Data Fig. 2d), the analogous Loop 2 region typically forms the C” beta strand, and the MHCII-binding residues of CD4 are located within or adjacent to the C” strand40 (Fig. 1h, Extended Data Fig. 2d). Moreover, a previously reported LAG3 P111A mutation that ablates MHCII binding28 is located Loop 2 (Extended Data Fig. 2d), suggesting a conserved functional role for the Loop 2 region in both LAG3 and CD4.
Comparison of human and murine LAG3 dimer interfaces.
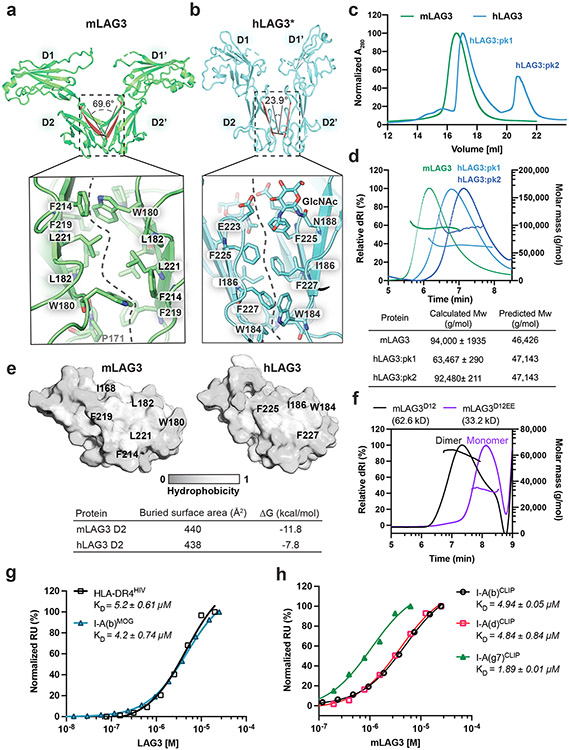
Both hLAG3* and mLAG3D12 crystallized as parallel homodimers mediated by D2-D2 contacts (Fig. 2a and 2b). This observation is consistent with crosslinking data suggesting that LAG3 forms oligomers on the cell surface, although oligomerization was previously suggested to occur through the D1 domain41. The D2-D2 orientation in mLAG3 was horizontally skewed compared to hLAG3*, with a larger twist angle (~46°) leading the mLAG3 domains to adopt a wide V-shaped architecture (Fig. 2a and 2b). The symmetrical mLAG3 dimer is mediated by a cluster of hydrophobic residues that bury 440 Å2 of surface area. In the center of the cluster, the indole side chain of Trp180 inserts into a pocket on the opposing protomer formed by the phenyl rings of Phe214 and Phe219 and the side chains of Leu182 and Leu221 (Fig. 2a, Extended Data Fig. 3a). The D2-D2 interface of hLAG3* buries a similar amount of surface area (438 Å2) and is mediated by Phe227 and Trp184, Ile186 and Phe225 residues that are analogous to the Trp180, Ile182, and Leu221 residues of mLAG3 (Fig. 2b). N-linked glycan modifications of Asn184 and Asn188 in murine and human LAG3, respectively, are present at the dimer interface. In hLAG3*, the N-acetylglucosamine (GlcNAc) modification of Asn188 forms polar contacts with Glu223 residue the opposing protomer. Although mLAG3 and hLAG3* adopt different dimer conformations, we cannot presently determine whether these conformations represent distinct functional states or species-specific structural features.
Figure 2. Structural and biochemical characterization of human and murine LAG3 dimers.
a-b, Comparison of mLAG3 and hLAG3 dimer conformations (top). Different D2-D2 packing geometries were observed in mLAG3 (a) and hLAG3 (b). The dihedral angles between D2 beta strands are highlighted in red. The lower panels depict residue networks at the dimer interfaces of mLAG3 (a) and hLAG3 (b). c, SEC chromatograms from hLAG3 and mLAG3 purification. d, SEC-MALS analyses of mLAG3, hLAG3:pk1, and hLAG3:pk2. Calculated and predicted molecular weights are listed in the table. e, Analyses of surface hydrophobicity for D2 domains of mLAG3 (left) and hLAG3 (right); lighter coloring indicates increased surface hydrophobicity. f, SEC-MALS analyses indicate that mLAG3D12 is a homodimer in solution while the mLAG3D12EE mutant is predominantly monomeric. g, SPR was used to determine the binding affinities of hLAG3* and mLAG3 for HLA-DR4HIV and I-A(b)MOG, respectively. h, SPR analyses of the binding affinities of mLAG3 binding to MHCII allomorphs I-A(b), I-A(d) and I-A(g7) loaded with CLIP peptide. The KD and standard deviation were determined by averaging the values from two independent experiments.
Experimental determination of LAG3 oligomeric state.
We used multi-angle light scattering coupled with size-exclusion chromatography (SEC-MALS) to experimentally assess the oligomeric state of human and murine LAG3 (Fig. 2c). Although murine and human LAG3 each crystallized as dimers, the proteins exhibit distinct elution profiles when purified on a size-exclusion chromatography (SEC) column. The mLAG3 protein eluted from the column as a single monodisperse peak, while the hLAG3 protein eluted as two separate peaks (hLAG3:pk1, hLAG3:pk2) (Fig. 2c). The mLAG3 protein has a predicted molecular mass of 46.6 kD, and the calculated molecular mass from MALS was 94.0kD, indicating that mLAG3 is dimeric in solution. The molecular weight of hLAG3 without glycosylation is 47.4 kD, and the calculated masses of hLAG3:pk1 and hLAG3:pk2 were 63.5 and 93.5 kD, respectively. The 63.5 kD peak approximately corresponds to the molecular mass of an hLAG3 monomer modified with N-linked glycans, and the 93.5 kD peak corresponds to a mixture of hLAG3 monomers and dimers. These data indicate that both hLAG3 and mLAG3 can form dimers in solution, and that a substantial amount of hLAG3 is present as a monomer at the concentrations tested.
Thermodynamic analysis of D2-D2 interfaces from the hLAG3* and mLAG3D12 structures suggests that dimerization of murine LAG3 is more energetically favorable (ΔG of −11.8 kcal/mol) than dimerization of human LAG3 (ΔG of −7.8 kcal/mol) (Fig. 2e). This conclusion is also supported by our DSF thermal denaturation data indicating that the Tm of mLAG3 (56 °C) is greater than that of hLAG3 (47.4 °C) (Extended Data Fig. 1f). We introduced two mutations in a mLAG3D12 construct to experimentally validate the dimer interface observed in the crystal structure. The mutant protein, mLAG3D12EE, contains W180E and L221E substitutions at opposing positions in the dimer interface that were designed to disrupt dimerization through charge repulsion. SEC-MALS analyses of the mLAG3D12EE protein revealed that the mutated protein was predominantly monomeric in solution, and that mLAG3D12 was dimeric (Fig. 2f), thus supporting our hypothesis that hydrophobic D2-D2 interactions mediate LAG3 dimerization.
MHCII-binding affinities of human and murine LAG3.
We used SPR to measure the MHCII-binding affinity of human and murine LAG3 proteins with different propensities for dimerization (Fig. 2g). We initially tested the binding of hLAG3* and mLAG3 to the MHCII allomorphs DR4 and I-A(b), respectively. We used the biochemically stable hLAG3* variant because the hLAG3 protein aggregated to the sensor chip at high concentrations (Extended Data Fig. 3b). The DR4 protein (HLA-DR4HIV) was loaded with a peptide derived from the HIV Gag protein (residues 164-183)42, and the I-A(b) protein (I-A(b)MOG) was loaded with a peptide from myelin oligodendrocyte protein, (residues 38–51)43,44. We determined that hLAG3* binds to HLA-DR4HIV with a KD of 5.2 μM (Fig. 2g and Extended Data Fig. 3b) and that mLAG3 binds to I-A(b)MOG with a KD of 4.2 μM (Fig. 3g and Extended Data Fig. 3c). The 5.2 μM affinity we determined between hLAG3* and HLA-DR4 is similar to the KD (6.9 to 13.1 μM) reported in a recently published biophysical study of hLAG3-Fc interactions with HLA-DR143.
Figure 3. Epitope mapping and functional characterization of LAG3 antagonist scFvs.
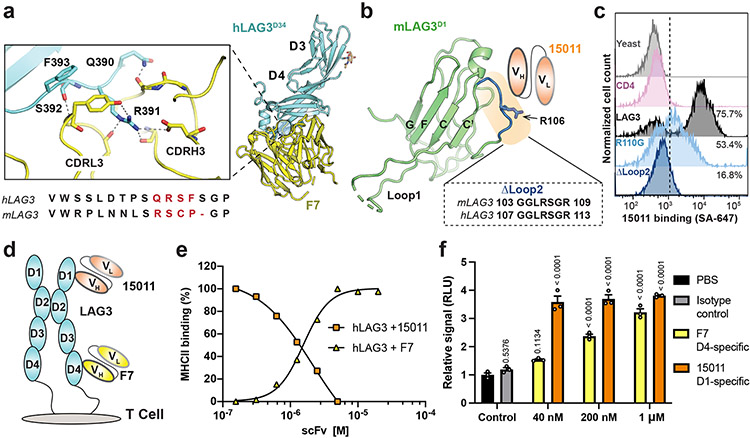
a, Zoom window depicting F7 epitope on the hLAG3D34:F7 structure. The F7-bound residues in hLAG3 (depicted below the zoom panel) are not conserved in mLAG3. b, The Arg106 residue and Loop 2 epitope recognized by 15011 are highlighted on the structure of the mLAG3 D1 domain. A sequence alignment shows the conservation of mLAG3 and hLAG3 Loop 2 residues. c, Flow cytometry histogram plots depicting the binding of yeast-displayed CD4, hLAG3, hLAG3R110G, and hLAG3ΔLoop2 to 15011. d, Cartoon representations of F7 and 15011 scFvs binding to hLAG3. e, An SPR-based competition assay was performed to determine whether the 15011 or F7 inhibits hLAG3:MHCII interactions. Fixed concentrations of hLAG3 (800 nM) mixed with various concentrations of 15011-Fc or F7-Fc fusion proteins were injected over a sensor chip coated with HLA-DR4. ΔRU was calculated by subtracting the Rmax of hLAG3 alone from the Rmax of hLAG3:scFv complexes. The curves were plotted from 1 of 2 representative experiments. f, NFAT reporter assay comparing potency of F7 and 15011 as LAG3 antagonists. Net signals were normalized to a PBS control for analyzing RLU. The graph represents the mean RLU ± SD of n=3 replicates from representative of two independent experiments and statistics in comparison with PBS control group determined by using one-way ANOVA with P values noted in the figure.
To determine whether LAG3 preferentially engages different MHCII allomorphs, we compared the binding affinities between mLAG3 and I-A(b), I-A(d) and I-A(g7). We also compared the binding affinities between hLAG3* and HLA-DR4, HLA-DP2. All human and murine MHCII proteins were loaded with CLIP to control for the possibility that the bound peptides influence LAG3 binding. We determined that CLIP-loaded I-A(b), I-A(d), and I-A(g7) bound to mLAG3 with similar affinities (KD 1.8-4.9 μM), with I-A(g7) as the highest affinity binder. Our calculated mLAG3:MHCII binding affinities were consistent with cell staining data comparing the relative binding of murine LAG3 to various MHCII subtypes28. For hLAG3*, the calculated binding affinities were similar for DR4 (KD 2.45 μM) and DP2 (KD 3.1 μM) (Extended Data Fig. 3e). Collectively, our data suggest that MHCII subtype contributes to LAG3 binding affinity, and that species-specific differences or differences in oligomerization state probably play a lesser role.
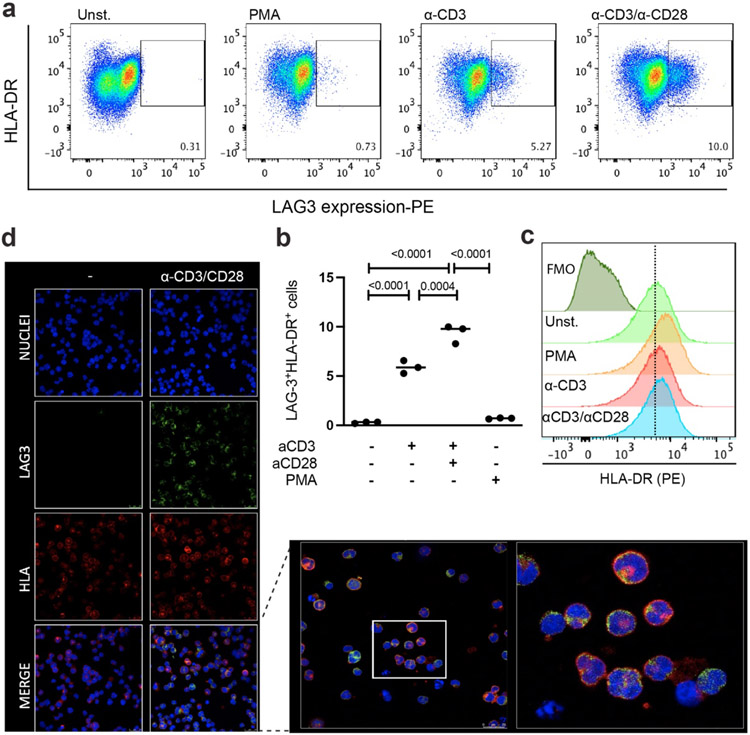
LAG3:MHCII interactions are often studied as trans binding events between T cells and APCs or tumor cells. However, activation of human T cells and certain leukemia cell lines induces the expression of LAG3 and MHCII on the same cell. To study whether cis-interactions affect the expression or distribution of LAG3 and MHCII on the cell surface, we used confocal microscopy to image the subcellular localization of MHCII and LAG3 in the leukemia cell line HuT 7846. Although the HuT 78 cells expressed high levels of MHCII and low levels of LAG3 following T cell activation (Extended Data Fig. 4a-c), the MHCII and LAG3 proteins were not colocalized on the cell surface (Extended Data Fig. 4d), suggesting that stable cis-interactions do not occur under the conditions tested.
Epitope mapping and characterization of LAG3 antibodies.
There is a lack of structure-function data linking the epitopes bound by LAG3 antibodies to their effect on LAG3 activity. To gain insight into the mechanism of antibody-mediated LAG3 inhibition, we analyzed the epitopes of two antagonist scFvs in the context of the hLAG3* crystal structure. The F7 was co-crystallized with hLAG3* and engages the juxtamembrane D4 of hLAG3 (Fig. 1d, 1f and 3b). F7 binds to LAG3 through residues in the complementarity-determining 3 regions (CDR3s) of the heavy (VH) and light (VL) chains, forming a network of salt bridges and hydrogen bonds with the Gln390, Arg391 and Ser392 residues of LAG3 (Fig. 3a). This binding epitope was unexpected given that D4 is not involved in binding to any of the known LAG3 ligands. The second scFv, derived from antibody 15011, was reported to bind the Arg110 residue of LAG347, which is in the Loop 2 region of D1 (Fig. 3b). In a cellular binding assay, we determined that an R110G mutation in LAG3 diminished binding to 15011 (Fig. 3c), and that deletion of Loop 2 residues Gly107 to Arg113 (Fig. 3c) completely abrogated 15011 binding (Fig. 3c). Therefore, we conclude that Loop 2 is the dominant epitope recognized by 15011.
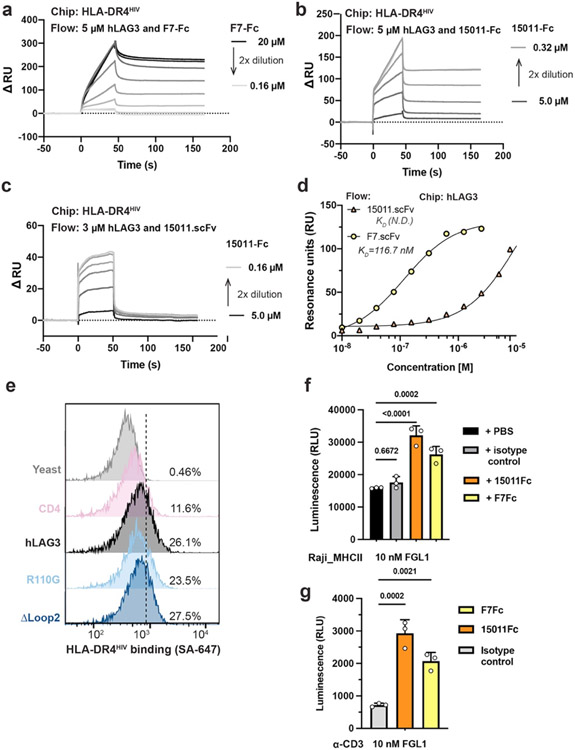
We next tested whether the F7 (D4-specific) or 15011 (D1-specific) scFvs inhibit LAG3:MHCII interactions (Fig. 3d). We expressed each scFv as an Fc fusion protein and tested how increasing concentrations of each scFv-Fc affected hLAG3 binding to recombinant HLA-DR4. This SPR-based competition assay revealed that the scFv of 15011, but not F7, blocked hLAG3:HLA-DR4 interactions (Fig. 3e, Extended Data Fig. 5a-5c). Given that the 15011 inhibits MHCII interactions and binds to Loop 2, and that the Pro115 residue within Loop 2 has been reported important for MHCII binding, we hypothesized that Loop 2 mediates LAG3 binding to MHCII. However, we found that deletion of Loop 2 residues Gly107 to Arg113 did not affect the binding of MHCII tetramers to LAG3-expressing cells (Extended Data Fig. 5e), indicating that MHCII binds an adjacent surface on the LAG3 protein.
We used a two-cell NFAT-luciferase reporter system to assess the potency of LAG3 antagonism by the F7 and 15011 scFvs. In this assay, LAG3+ Jurkat cells expressing an NFAT-driven luciferase reporter were co-cultured with antigen-presenting cells to stimulate T cell activation. The cells were then treated with various concentrations of antagonist scFv-Fc fusion proteins, and the reversal of LAG3-mediated suppression was monitored as a function of increasing NFAT reporter activity. We determined that the F7 induced a dose-dependent increase in NFAT expression, with a 3.2-fold increase compared to control cells at the maximum dose (1000 nM). The 15011 was a more potent antagonist than F7 and induced a ~3.8-fold increase in NFAT activation at all concentrations tested (Fig. 3f). We also determined that addition of FGL1 did not have a substantial effect on antagonism by either scFv, regardless of whether the reporter cells were activated by a CD3 antibody or APCs (Extended Data Fig. 5f-5g). The increased potency of 15011 was independent of LAG3 binding affinity, as F7 bound to LAG3 with higher affinity than 15011 (Extended Data Fig. 5d). Together, this mapping and functional data identifies the Loop 2 epitope as an effective target for the development of dual ligand-blocking antibodies.
Mapping the FGL1-binding interface of LAG3.
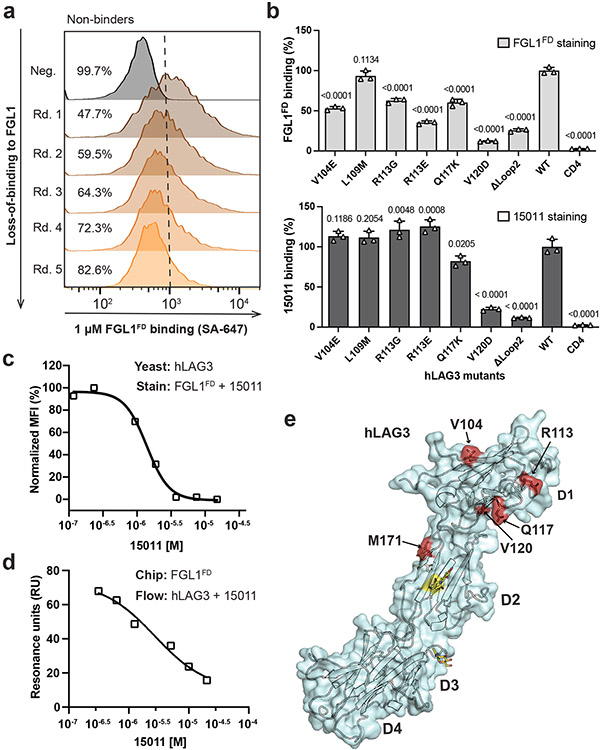
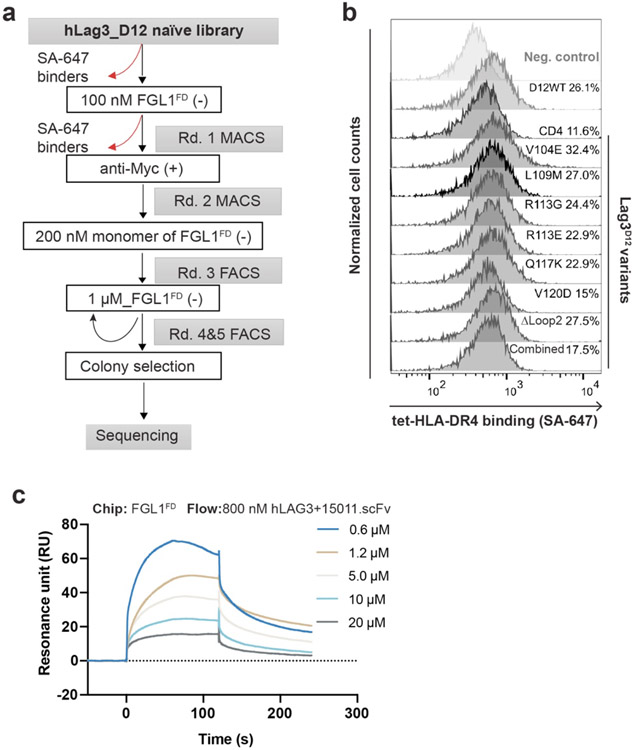
Although previous studies have identified LAG3 residues that mediate LAG3 binding to MHCII29 and α-synuclein34, the structural basis for LAG3:FGL1 interactions is unknown. Therefore, we used our hLAG3D12 mutant library (described above) to map the FGL1-binding interface of LAG3. We performed several rounds of negative selection to enrich for mutants that decreased FGL1FD binding to hLAG3 (Fig. 4a and Extended Data Fig. 6a). Sequence analysis of the negatively selected population revealed four single-mutant variants in hLAG3 D1: V104E, R113E, Q117K and V120D. We determined that each of these mutations diminished FGL1 binding in a fluorescence-based assay (Fig. 4b). Notably, all four of the mutations were located within or adjacent to Loop 2 in the structure of hLAG3*. The greatest reduction in binding resulted from a V120D substitution, which is proximal to the C-terminal end of Loop 2.
Figure 4. Identification of an FGL1-binding surface on the LAG3.
a, Flow cytometry histogram plots depicting the reduction in hLAG3 binding to FGL1FD over subsequent rounds of negative selection. b, Yeast expressing various LAG3 mutants were stained with FGL1FD (750 nM) or 15011 (100 nM) and binding was analyzed by flow cytometry. Relative binding indicates the MFI normalized to wildtype hLAG3. Data represent mean MFI ± SD of n=3 independent staining, and statistics determined by using one-way analysis of variance (ANOVA) with P values noted in the figure. Representative of two independent experiments is shown. c-d, Competition assays evaluating the ability of the scFv of 15011 to inhibit FGL1FD binding to hLAG3. In c, yeast expressing hLAG3 were incubated with biotinylated FGL1FD (500 nM) and the indicated concentrations of 15011. In d, samples containing hLAG3 (800 nM) and various concentrations of 15011 scFv were injected over an SPR sensor chip coated with FGL1FD. In c and d, one representative of two independent experiments is shown. e, Mutations that diminished LAG3:FGL1 binding (red) are mapped on to the structure of hLAG3*.
To cross-validate the FGL1 binding site, we tested whether the mutations described above inhibited LAG3 interactions with the Loop 2-specific 15011. We determined that the Q117K and V120D mutations reduced LAG3 binding to 15011, and that the V104E and R113E mutations did not have a significant effect. We next performed SPR-based and cell-based competition assays to determine whether 15011 inhibits FGL1 binding to LAG3. In both assays, the addition of 15011 lead to a dose-dependent decrease in LAG3 binding (Fig. 4c, 4d and Extended Data Fig. 6c). This mapping and competition data indicate that 15011 and FGL1 have overlapping, but non-identical binding sites on the LAG3 protein. Taken together, our loss-of-binding mutations and affinity-enhancing M171I mutation reveal an extended FGL1-binding surface that includes Loop 2 of D1 (V104, R113, Q117, V120) (Fig. 4e).
Crystal structure of FGL1FD.
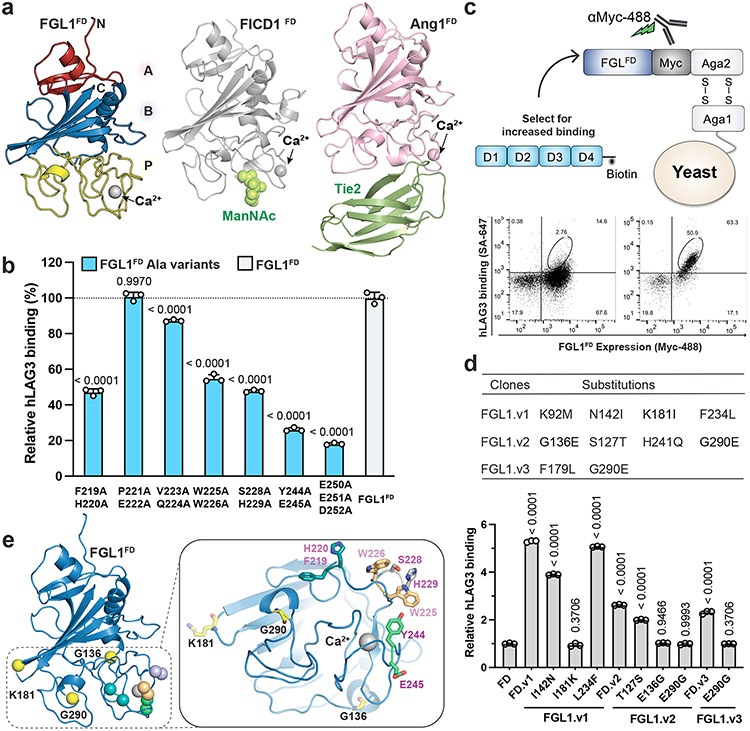
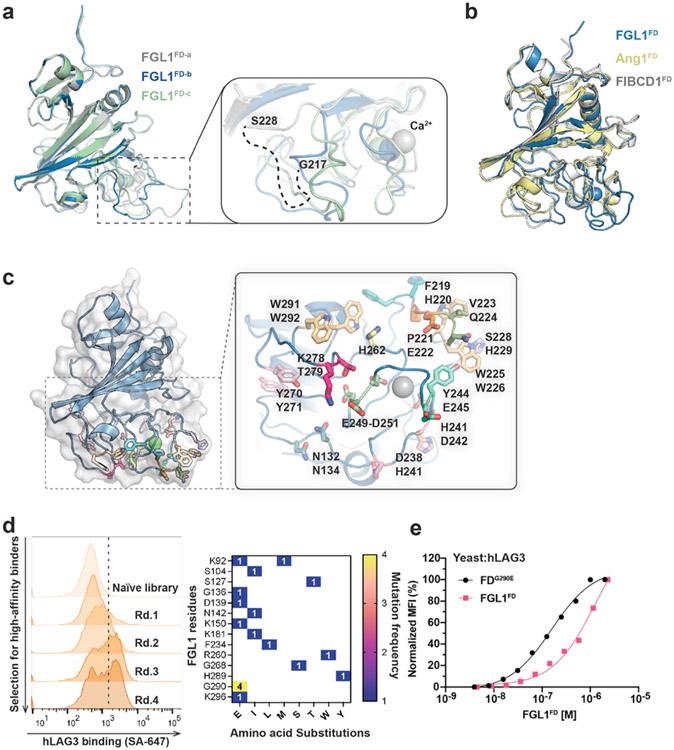
We subsequently determined the 2.55 Å resolution structure of human FGL1FD to visualize the LAG3-binding domain of FGL1 (Fig. 5a and Extended Data Fig. 7a). The structural comparison server PDBeFold48 indicated that the FGL1FD is most similar to the fibrinogen-like domains of Fibrinogen C domain-containing protein 1 (FIBCD1FD, PDB ID: 4M7F, RMSD=1.21 Å) and Angiopoietin 1 (Ang1FD, PDB ID: 4EPU, RMSD=1.12 Å). Fibrinogen-like domains are comprised of A, B, and P subdomains. Alignment of FGL1FD, FIBCD1FD, and Ang1FD revealed that the overall architectures of the A and B subdomains are similar, and that the loops of the poorly-conserved P subdomains adopt distinct conformations in each protein (Extended Data Fig. 7b).
Figure 5. Structure and LAG3-interacting residues of FGL1FD.
a, Crystal structure of FGL1FD and structural comparison to Fibrinogen-like domains from FIBCD1 (PDB ID: 4M7F) and Ang1 (PDB ID: 4EPU). The A, B and P subdomains of FGL1FD are colored in red, blue and yellow, respectively (left panel). The FIBCD1 ligand ManNAc and the Ang1 ligand Tie2 bind to similar positions on the P domains. b, Alanine scanning mutagenesis was used to identify LAG3-binding residues on FGL1. Yeast expressing alanine mutants of FGL1FD were stained with biotinylated hLAG3 and binding was analyzed by flow cytometry. Relative binding was adjusted based on cell surface expression levels of each mutant. c, Cartoon schematic of the FGL1FD yeast display construct used to generate a mutant library. Flow cytometry dot plots depict the binding of hLAG3 to yeast isolated from the initial and final rounds of selection. d, Table containing mutations identified in FGL1 variants following yeast display selections for enhanced LAG3-binding (top). A series of reversion mutants were expressed on yeast, stained with hLAG3, and analyzed by flow cytometry to identify which mutations conferred increased binding (bottom). MFI of LAG3 binding were adjusted to the surface expression level of each variant and normalized to that of wildtype FGL1FD. e, Residues that positively or negatively affect FGL1 binding to hLAG3 were mapped on the structure of FGL1FD. The affinity-enhancing mutations K181, G136 and G290 are colored in yellow, and pairs of alanine mutants are shown in matching colors. In b and d, data represent the mean relative binding ± SD of three independent replicates from representative of two independent experiments and statistics determined by using one-way analysis of variance (ANOVA) with P values noted in the figure.
Mapping the LAG3-binding site on FGL1.
P subdomains contain flexible loops that typically facilitate protein-protein interactions49, and the P subdomains of FIBCD1FD and Ang1FD mediate binding to the ligands (ManNAc) or Tie250, respectively (Fig. 5a, Extended Data Fig. 7b). Therefore, we hypothesized that the LAG3-binding interface of FGL1 would be contained within this region. To map a LAG3-binding site on FGL1, we generated a panel of 14 double-alanine mutants and a triple-alanine mutant in surface-exposed regions of the FGL1 P subdomain (Extended Data Figure 7c). We then displayed WT FGL1FD and each mutant on the surface of yeast cells and tested their ability to bind to hLAG3. Seven of the variants bound non-specifically to control proteins and were excluded from further analysis. We compared the binding of the remaining seven mutants to hLAG3* and hLAG3D12 and determined that the F219A/H220A, W225A/W226A, S228A/H229A, Y244A/E245A and E250A/E251A/D252A mutants exhibited decreased hLAG3 binding to FGL1FD (Fig. 5b). The most substantial decreases were observed for Y244A/E245A and E250A/E251A/D252A, which reduced the binding by 75% and 80%, respectively.
As a parallel strategy for identifying LAG3-interacting residues on FGL1, we used yeast display to evolve FGL1 variants with enhanced affinity for LAG3. We generated an unbiased mutant library of FGL1FD and performed several rounds of selections against hLAG3 to isolate high-affinity binders (Fig. 5c and Extended Data Fig. 7d). We identified several mutations within or adjacent to the P subdomain (Extended Data Fig. 7d). To distinguish between affinity-enhancing and spurious mutations, we generated a series of constructs in which each mutated residue was reverted to the WT sequence. We then performed a fluorescence-based binding assay to monitor how the reversions affected LAG3 binding. We determined that G136E, K181I, and G290E mutations enhanced FGL1FD binding to hLAG3, and that the remaining mutations had a minimal effect on LAG3 binding (Fig. 5d). Additionally, we found that an FGL1FD protein containing a single G290E mutation exhibited increased dose-dependent binding to hLAG3 relative to FGL1FD (Extended Data Fig. 7e). Mapping the affinity-enhancing mutations above and the affinity-reducing F219A, H220A, W225A, W226A, Y244A, E245A, E250A, E251A, and D252A mutations onto the structure of FGL1FD revealed a putative LAG3-binding surface within the P subdomain (Fig. 5e).
LAG3:FGL1 complexes forms clusters on the cell surface.
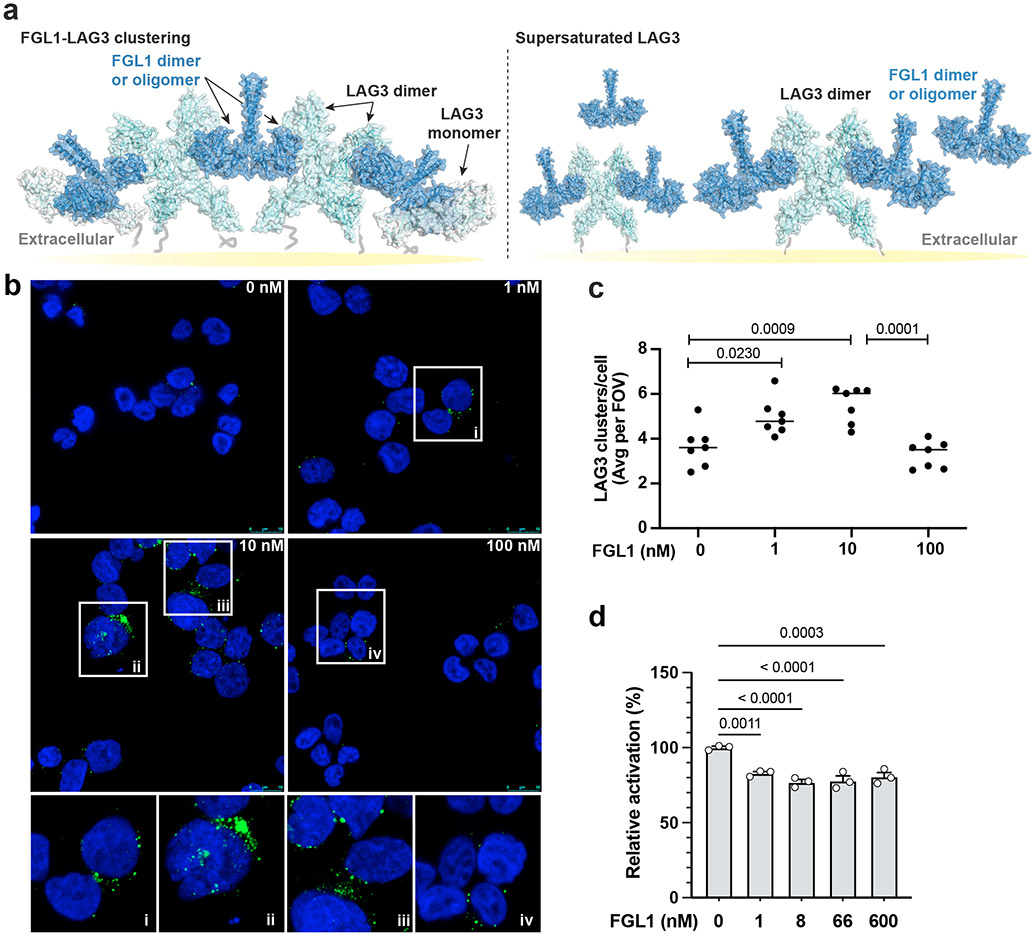
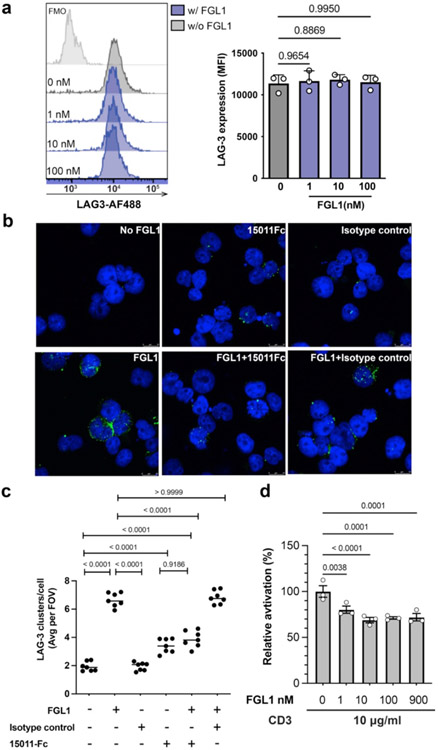
FGL1 is a disulfide-linked dimer and has been reported to multimerize in solution31,51. Our interface mapping data suggests that two FGL1 protomers will bind to opposing sides of the LAG3 dimer, and steric constraints would preclude the assembly of a 2:2 LAG3:FGL1 complex. Instead, FGL1 binding is predicted to crosslink LAG3 dimers, resulting in the formation of higher-order LAG3-FGL1 oligomers (Fig. 6a). To experimentally determine whether FGL1 induces LAG3 clustering, we used fluorescence microscopy to visualize the subcellular localization of LAG3 on Jurkat cells treated with FGL1. We observed the formation of LAG3 clusters when the cells were incubated with three different concentrations of FGL1 (1 nM and 10 nM and 100 nM) (Fig. 6b). Flow cytometry analysis indicated that the LAG3 antibody used for detection bound similarly to all samples regardless of the concentration of FGL1, which excludes the possibility of FGL1 competing for the antibody binding site (Extended Data Fig. 8a). On the other hand, the number of clusters decreased significantly when the cells were treated with FGL1 and the FGL1-blocking 15011, indicating that the effect was specifically inducted by FGL1(Extended Data Fig. 8b and 8c). Notably, the number of clusters was reduced at 100 nM compared to 10 nM (Fig. 6b and 6c). One possible explanation for this reduction is that clustering requires stoichiometric amounts of LAG3 and FGL1, and that high concentrations of FGL1 inhibits intermolecular crosslinking by saturating the FGL1-binding sites on LAG3 (Fig. 6a).
Figure 6. FGL1-induced LAG3 clustering correlates with FGL1 suppression mechanism.
a, A cartoon model of full-length FGL1 bound to LAG3 is shown as the interaction is predicted to occur on the cell surface. The left panel depicts stoichiometric amounts of FGL1 crosslinking LAG3 dimers to form higher-order oligomers, and the right panel depicts the loss of LAG3 clustering in the presence of excess FGL1. b, Stacked confocal microscopy images displaying LAG3 (green) and DAPI (blue) in Jurkat T cells expressing LAG3, either untreated or treated with 1, 10 or 100 nM of FGL1 protein for 30 min. c, The number of LAG3 clusters per cell was quantified and plotted as the average per field of view (FOV) from 1 of 3 representative experiments. Analysis was performed from n = 7 fields of view. d, An NFAT luciferase reporter assay was performed to assess the effect of FGL1 on LAG3-mediated suppression of T cell activation mediated by pMHCII. The relative activation was obtained by normalizing baseline-subtracted luciferase signals of tested concentrations to the buffer control group. In d, the graph represents n=3 replicates from representative of two independent experiments. All staistics was determined by one-way ANOVA with P values noted in the figure.
We next assessed how different concentrations of FGL1 affect T cell activation in LAG3+ NFAT reporter Jurkat cells. We stimulated T cell activation either by co-culturing the cells with APCs or by culturing the cells on plates coated with an antibody to CD3. In both experiments we observed that increasing concentrations of FGL1 above 10 nM threshold did not significantly affect NFAT reporter activity (Fig. 6d and Extended Data Fig. 8d).
DISCUSSION
Several major immune checkpoint receptors, such as PD-1, CTLA4, and TIGIT, have established ligand-binding modes and intracellular motifs (e.g. ITIMS) that provide insight into their T cell suppression mechanisms. LAG3 is an outlier in this regard, as both the ligand-binding D1 of LAG3 and the non-canonical intracellular domain are poorly conserved among Ig-superfamily receptors. Our structure-function studies highlight several important features in the molecular architecture of the LAG3 protein. First, we identify that a previously uncharacterized Loop 2 region in LAG3 D1 domain is recognized by both a potent antagonist antibody (15011) and the recently discovered LAG3 ligand, FGL1. Loop 2 is located between the C’ and D strands of LAG3 D1 and replaces the C” strand in conventional V-set Ig-like domains such as CD4. We found that removing Loop 2 does not significantly affect MHCII binding, however, 15011 binding to Loop 2 blocked LAG3 engagement of MHCII and reversed LAG3-mediated suppression of T cell activation. We also determined that 15011 inhibits LAG3 binding to FGL1 binding in an in vitro competition assay. The discovery that Loop 2 is both an FGL1 binding site and a major epitope for a dual ligand-blocking scFv may therefore guide the development of optimal LAG3-targeting antibodies.
Our structural and biochemical studies determined that LAG3 forms homodimers mediated by a conserved, hydrophobic interface in D2. In the crystal structure of hLAG3*, the D1 domains were oriented in a more vertical “up” conformation, whereas the D1 domains in the mLAG3D12 were tilted into a “down” conformation. Although the significance of these differences is currently unclear, it is possible that flexibility of the D1-D2 or D3-D4 hinges enables LAG3 to ratchet into active or autoinhibited conformations depending on whether a ligand is bound. Such reorientations have been observed in other receptor systems, such as the cytokine receptors, where ligand binding induces conformational changes that propagate to the ICDs to mediate downstream signaling52,53. Alternatively, the different lengths of the Loop1 insertion in mLAG3 compared to hLAG3 may contribute to steric clashes that drive the dimers to adopt distinct conformations.
FGL1 was only recently identified as a LAG3 ligand, and the molecular basis LAG3:FGL1 interactions has not been thoroughly characterized. Our yeast display experiments revealed several mutations that establish binding interfaces on both sides of the LAG3:FGL1 interaction. The FGL1-binding residues of hLAG3 were positioned within Loop 2 of D1, adjacent to Loop 2, or proximal to the N-terminus of D2. On the FGL1 side, LAG3-binding mutations mapped to the canonical ligand-binding P subdomain of the FGL1FD. This interface mapping data suggests that FGL1 binding to LAG3 is not sterically compatible with the formation of a 2:2 complex with an FGL1 dimer simultaneously binds both protomers of a single LAG3 homodimer. As the FGL1 binding site is positioned opposite to the LAG3 dimeric interface, we hypothesized that FGL1 crosslinks LAG3 to “nucleate” the formation of the higher-order LAG3 oligomers. Our fluorescence microscopy imaging supported this hypothesis by revealing the FGL1-induced formation of LAG3 clusters on the surface of Jurkat cells. Homodimerization of the receptor tyrosine kinase Tie2 has also been shown to facilitate clustering and optimal signaling following Ang1 engagement54, suggesting a conserved mechanism for receptor activation by Fibrinogen-like and Angiopoietin-like proteins.
It was previously reported that LAG3 accumulates in lipid rafts with CD3, CD4, and the TCR during primary T cell activation, and that this manner of LAG3 clustering occurs regardless of whether T cells are activated through cellular MHCII or antibody-coated beads22,24,55. Our finding that FGL1 induces the LAG3 clustering suggest a similar mechanism for LAG3-mediated T cell suppression by the soluble FGL1 ligand. At present, it is unclear how LAG3 clustering is linked to T cell suppression, but possibilities include steric inhibition of optimal immune synapse formation or a yet unknown signaling event that requires ligand-mediated LAG3 crosslinking. We determined that relatively low (10 nM) concentrations of FGL1 are sufficient for cluster formation and LAG3 inhibition. The concentration range of FGL1 in rat serum is below 10 nM56, indicating that FGL1-mediated clustering could occur at physiological concentrations. Although no significant increase in the suppressive effect of FGL1 was observed at higher concentrations, we hypothesize that this is due to supersaturation of FGL1 binding sites on LAG3 proteins, which would be predicted to inhibit, rather than promote, LAG3 crosslinking.
Collectively, our structural, epitope mapping, and functional studies provide an improved framework for understanding LAG3 molecular function. In the future, additional structures of LAG3 bound to ligands and antibodies will refine our knowledge of the LAG3 signaling axis to illuminate how extracellular binding events fine-tune LAG3-mediated changes in T cell activity. In turn, such structural insights should guide the development of maximally effective LAG3-based immunotherapies.
MATERIALS AND METHODS
Protein expression and purification.
Human LAG3 (hLAG3, residues 23-450), hLAG3* (hLAG3 containing M171I mutation), hLAG3D12 (residues 23-260), murine LAG3 (residues 23-442), and murine LAG3 domains 1 and 2 (mLAG3D12, residues 23-254), were cloned into pAcGp67A as fusions to a C-terminal biotin-acceptor peptide tag (BAP-tag: GLNDIFEAQKIEW) followed by a 6xHis tag. The Fibrinogen-like domain of FGL1 (FGL1FD, residues 58-312) was cloned into pAcGp67A with a C-terminal 3C protease site followed by BAP and 6xHis tags. FGL1 (residues 1-312) was cloned into a pVL1393 vector modified with a C-terminal 8xHis tag. The 15011.scFv was generated by fusing the VH and VL from 15011 antibody47 using a (GGGGS)3 linker. 15011.scFv and F7.scFv37 were cloned into pAcGp67A vector with a C-terminal 8xHis tag or a C-terminal human IgG1 Fc plus 6xHis tags. The α chain (DRA*0101) of HLA-DR4 and the β chain (DRB1*0401) of HLA-DR4 linked to a N-terminal thrombin-cleavable p24 HIV Gag peptide (aa 164–183: AFSPEVIPMFSALSEGATPQ) were fused to acid/base zippers from C-jun or C-fos transcription factors, respectively42. Both chains contained C-terminal 6xHis tags for affinity purification, and the β chain (DRB1*0401) also included a C-terminal BAP tag.
All recombinant proteins were expressed using Baculovirus by infecting Hi-Five cells (Invitrogen) from Trichoplusia ni at a density of 2x10⁶ cells/mL for three days 27°C before harvesting the culture. For HLA-DR4HIV, cells were coinfected with Baculovirus corresponding to the alpha and beta chains. The hLAG3, mLAG3, FGL1, FGL1FD, and scFv proteins were each purified from culture supernatants by nickel affinity (Nickel-NTA resin, Qiagen) chromatography followed by size-exclusion chromatography. The hLAG3 proteins used for binding experiments were site-specifically biotinylated using BirA ligase. Biotinylated I-AbCLIP and I-AbMOG proteins were obtained from the NIH tetramer facility.
Yeast display of LAG3 and FGL1.
The hLAG3D12, hLAG3, and FGL1FD constructs were cloned into a modified pCT vector as N-terminal fusions to a c-Myc epitope tag and the yeast cell wall protein Aga2. Plasmids were transformed into S. cerevisiae EBY100 cells by electroporation and recovered in SD-CAA media at 30° C. Yeast cultures in the logarithmic growth phase were then induced by resuspension in SG-CAA media at 20°. After 48 hours, expression was detected by flow cytometry following yeast staining with an Alexa Fluor 488-conjugated anti-Myc antibody (anti-Myc-488, Cell Signaling) or Alexa Fluor 647-conjugated anti-Myc antibody (anti-Myc-647, Cell Signaling).
Mutant library generation.
A mutant library of LAG3D12 was generated by error-prone PCR using a Genemorph II Kit (Agilent). The amount of LAG3D12 DNA template used in the PCR reaction was optimized to achieve a final average mutation rate of ~5 base pairs /gene. The selected PCR products were then amplified using specific primers containing homology overlaps with the linearized yeast display vector. Gel-purified PCR products and linearized vector DNA were co-electroporated into EBY100 cells, recovered in SD-CAA media, and induced in SG-CAA media prior to performing selections. The transformed library contained 8x10⁷ transformants of LAG3D12. The mutant library of FGL1FD was generated following the same protocol that was used for hLAG3D12 and contained 3x10⁸ transformants.
Yeast display selections.
For all initial rounds of selection, yeast amounting to 10-fold greater than the library diversity were used (e.g. 8x10⁸ yeast for the LAG3D12 library above). For subsequent rounds, 10x the number of yeast recovered from the previous round were used. Prior to each round, a negative selection was performed a to remove non-specific binders. Negative selections were performed by mixing the yeast with streptavidin labeled with Alexa Fluor 647 (SA-647) and streptavidin- or anti-647-coated microbeads (Miltenyi). The yeast were then flowed over a MACS LS column (Miltenyi) and the flow through was collected and used for positive selections.
Selection of LAG3 variants with enhanced FGL1 binding.
The LAG3D12 library was selected for increased surface expression and binding to FGL1FD In round 1, yeast were resuspended in PBS-MB (phosphate buffered saline containing 5 mM maltose, 0.1% BSA) , mixed with 100 nM of FGL1FD tetramers, washed, and then incubated with 250 μL Anti-Alexa Flour 647 microbeads (anti-647, Miltenyi). The yeast were loaded onto an LS column (Miltenyi) and the FGL1FD binders were isolated using magnetic activated cell sorting (MACS). In round 2, yeast were incubated with 1 μM biotinylated FGL1FD, washed and then stained with SA-647 and an anti-Myc antibody labeled with Alexa Fluor 488 (anti-Myc-488). High-affinity binders, represented by the double-positive 488/647 population, were then isolated using fluorescence-activated cell sorting (FACS) on a SH800S cell sorter (Sony). Rounds 3 to 5 were performed similarly to round 2, except the concentrations of FGL1FD were 20 nM, 100 nM and 50 nM, respectively.
Selection of LAG3 variants with diminished FGL1 binding.
A series of negative selections were performed to isolate LAG3 variants with decreased binding to FGL1FD. In round 1, the naïve LAG3 mutant library was stained with biotinylated FGL1FD, washed, and then stained with SA-647 to detect binding to FGL1FD. The library was also stained with anti-Myc-488 to detect protein expression. A FACS sort was then performed to isolate the yeast bound to the anti-Myc antibody but not to the FGL1FD. This selection protocol was repeated for three iterative rounds using FGL1FD concentrations of 200 nM, 1 μM and 1 μM, respectively.
Selection of FGL1 variants with enhanced LAG3 binding.
To select for high-affinity LAG3 binders from the FGL1FD library, round 1 was performed using MACS following incubation with 1 μM of biotinylated hLAG3, SA-647, and anti-647 beads. Five iterative rounds of FACS were then performed after incubation with an anti-Myc-488 antibody and hLAG3 concentrations of 1000 nM, 500 nM, 100 nM, 50 nM and 25 nM, respectively.
Sequencing of yeast following selections.
Once a given set of selections was completed, yeast were plated on SDCAA plates. LAG3 or FGL1 colonies were then picked, cultured, in SDCAA, and induced in SGCAA. These individual clones were then tested for binding to FGL1FD or hLAG3, respectively, using flow cytometry. Plasmids from selected clones were extracted (Zymoprep II Kit, Zymo Research) and sequenced to identify affinity-enhancing or affinity-decreasing mutations. For the LAG3D12 clones, a dose-titration binding experiment was performed by staining yeast expressing LAG3 variants with increasing concentrations of FGL1FD followed by secondary staining with SA-647. Individual clones were also stained with Alexa Fluor 488/anti-Myc to monitor expression levels, and binding was normalized to expression. The normalized signals were plotted as a function of concentration using Prism 9 (GraphPad).
Differential scanning fluorimetry.
Differential scanning fluorimetry (DSF) thermal denaturation experiments were performed using the Protein Thermal Shift Dye Kit (Applied Biosystems) according to the instructions. Purified hLAG3, hLAG3* and mLAG3 was diluted to a final concentration of 4 μM by mixing with the 2.5 μl of 8x Dye, 5 ul of protein thermal shift buffer (pH 7.2) and PBS buffer to a final 20 μl solution. The fluorescence was assessed by the StepOnePlus Real-Time PCR System (Applied Biosystems) at increasing temperature from 20 °C to 99 °C with a rate of 1 °C per min. Each sample had four independent replicates. Tm values were calculated by Protein Thermal Shift Software (Applied Biosystems).
SPR binding studies.
Surface plasmon resonance experiments were performed on a BIAcore T100 instrument (GE Healthcare). Approximately 300 resonance units (RU) of biotinylated FGL1FD, 350 RU of each MHCII protein (HLA-DR4HIV, I-AbCLIP (human CLIP87-101: PVSKMRMATPLLMQA), or I-AbMOG (murine MOG38-49: GWYRSPFSRVVH)), or 250 RU of hLAG3 were immobilized on streptavidin coated sensor chips (S series SA chip, GE Healthcare). Increasing concentrations of recombinant analyte proteins were flowed over the chip in PBS buffer supplemented with 0.005% surfactant P20 (PBS-P) at 20°C. Binding and dissociation phases were performed at 45 μl/min for 120 seconds and 120 seconds, respectively. For LAG3 binding to FGL1FD, the chip was regenerated after each injection with 30-second washes of 25% ethylene glycol containing 500 nM NaCl. For LAG3 binding to MHCII, the chips were regenerated with 30-second washes of 25% ethylene glycol containing 500 nM NaCl. For scFv binding to hLAG3, the chip was regenerated with 30-second washes of 25% ethylene glycol containing 1M NaCl. All curves were reference-subtracted from a flow cell containing a similar immobilization response of a non-related negative control protein (biotinylated extracellular domain of murine RNF43). The maximum RU (Rmax) for each experiment was plotted as a function of concentration using Prism 9 (GraphPad). Steady-state binding parameters were determined based on a 1:1 Langmuir model using the BIAcore T100 evaluation software.
SPR based competition assays.
The SPR-based competition assay between 15011 and FGL1FD was performed by creating a series of samples containing a constant concentration of hLAG3 (800 nM) and increasing concentrations of 15011scFv-Fc. The samples were then flowed over an SA-coated sensor chip containing immobilized biotinylated hLAG3. Binding and dissociation phases were performed at 30μl/min for 120 seconds each. The binding curves were reference-subtracted from a flow cell coated with a negative control protein (biotinylated murine RNF43). For competition assays assessing the ability of scFvs to inhibit hLAG3:MHCII interactions, mixtures of hLAG3 and scFv-Fc proteins were flowed over a SA-coated sensor chip containing immobilized biotinylated HLA-DR4HIV. Binding and dissociation phases were performed at 20μl/min for 50 seconds and 120 seconds, respectively. The binding curves were reference-subtracted from a flow cell containing an equivalent amount of a negative control protein (mouse RNF43). ΔRU was calculated by subtracting the Rmax value of the hLAG3:scFv mixtures from the Rmax value of hLAG3 alone. RU or ΔRU was plotted as a function of concentration using Prism 9 (GraphPad).
Multi-angle light scattering (MALS).
All experiments were carried out with a Superdex 200 (5/150 GL) connected in-line to a Dawn Heleos II multi-angle light-scattering (MALS) detector (Wyatt Technologies, Santa Barbara, CA). For each experiment, 10 μL of protein at 1 mg/mL was injected into the column equilibrated in PBS buffer at room temperature. Molecular weights were determined using Astra software package version 7.3 (Wyatt Technology Corporation, Santa Barbara, CA). All experiments were performed at least in triplicates.
Proteolytic processing and deglycosylation of proteins for crystallization.
hLAG3, hLAG3* and mLAG3D12 were individually purified as described above and then enzymatically treated to remove C-terminal tags and N-linked glycans prior to sparse matrix crystallization screening. LAG3 proteins intended for deglycosylation were expressed by additionally supplying 5 μM kifunensine at the time of infection. Kifunensine-sensitized hLAG3, hLAG3* or mLAG3D12 were purified using Nickel-NTA and SEC, and then treated overnight at 4°C with 1:200 (w/w) Endoglycosidase F1, 1:100 (w/w) bovine carboxypeptidase A (Sigma) and 1:200 (w/w) bovine carboxypeptidase B (Sigma) to remove N-linked glycans and disordered residues at the C-terminus of the protein. The C -terminal tag of FGL1FD were cleaved by incubating the protein with 1:500 (w/w) 3C protease overnight at 4°C before adding bovine carboxypeptidase A and bovine carboxypeptidase B. The enzymatically processed hLAG3* or hLAG3D34 proteins were mixed at 1:1.2 ratio with F7 and applied to a Superdex75 increase (10/300 GL column remove the excess scFv.
Crystallization of hLAG3:F7.scFv complexes, mLAG3D12 and FGL1FD.
Purified hLAG3:F7.scFv complex and hLAG3D34:F7.scFv complexes were concentrated to 22 mg/mL and 26 mg/mL, respectively, prior to crystallization screening. The mLAG3D12 protein was concentrated to 20 mg/ml. Crystals of FGL1FD were obtained from drops containing the FGL1FD and mLAG3D12 proteins mixed at a 1.5 to 1 ratio at a final concentration of 30 mg/ml. All protein crystals were grown by sitting drop vapor diffusion. Drops containing 0.1 μL of protein were combined with 0.1 μL of mother liquor. hLAG3*:F7.scFv crystals were grown from mother liquor containing 1% Tacsimate at pH 5.0, 0.05 M sodium citrate tribasic dihydrate, pH 5.6 and 7% PEG3350. hLAG3D34:F7 crystals were grown from the mother liquor containing 0.1 M HEPES at pH 7.1, and 13% PEG20000. The crystals were cryoprotected by adding glycerol into the mother liquor to a final concentration of 25% prior to plunge-freezing in liquid nitrogen. mLAG3D12 crystals were obtained from mother liquor containing 2 M ammonium sulfate. The crystals were cryoprotected by direct plunge-freezing in liquid nitrogen. Although it was mixed with mLAG3D12, the FGL1FD protein alone crystallized in 1 M lithium chloride, 0.1 M citric acid pH 5.0 and 20% PEG 6000. The FGL1FD crystals were cryoprotected by adding ethylene glycol to the mother liquor to a final concentration of 25% prior to plunge-freezing in liquid nitrogen. The data for hLAG3:F7, hLAG3D34:F7, mLAG3D12, and FGL1FD were collected at Advanced Photon Source beamline 23-ID-D, 23-ID-D, 22-ID and 19-ID, respectively. Datasets of LAG3 crystals and FGL1FD crystals were indexed, integrated, scaled and merged with the XDS package (Version January 31, 2020, BUILT=20200131)57 or HKL3000 (v721.3) and CCP4 (v7.0.058)58,59.
Crystal structure determination.
The mLAG3D12 structure was solved by molecular replacement (MR) with Phaser-MR in Phenix60. The MR models for D1 and D2 were threaded models generated with the Phyre2 server61. The D1 domain was modeled from the voltage-gated sodium channel beta3 subunit Ig domain (PDB ID: 4L1D), and the D2 domain was modeled from the I-band fragment I65-I70 from titin (PDB ID: 3B43). The hLAG3*:F7.scFv complex structure was determined by MR using the D1 and D2 domains from mLAG3D12 structure. A threaded model of the D3 domain was generated in Phyre2 server based on the structure of V-set and immunoglobulin domain-containing protein 4 (VSIG4, PDB ID: 2ICE, chain S), and the F7 scFv model was generated based on the structure of an scFv that binds to prolactin receptor (PDB ID: 6DSI). The model for D4 was derived from the hLAG3D34:F7 structure described below.
The structure of hLAG3D34:F7 model was solved by molecular replacement using the structures of F7 and the D3 domain from the hLAG3*:F7 complex structure. The D4 domain was manually built into the refined electron density map. The models were first subjected to rigid body refinement using the Phenix.refine62,63, followed by iterative rounds of building in Coot64 and several rounds of positional and B-factor refinement restrained by non-crystallographic symmetry64.
The structure of FGL1FD was solved by molecular replacement using Phaser. The model was created in Phyre2 using a 1-to-1 threading model generated from the crystal structure of FIBCD1 (FIBCD1FD, PDB ID: 4M7F). Model building and refinement were performed using Coot and Phenix.refine, respectively. In the final structure of hLAG3*:F7 complex, chain D of hLAG3* has unmodeled gaps spanning from Ser73 to Gln99 and from Thr428 to Leu450. Chain C of hLAG3* had several unmodeled regions in D1, including Ala73 to Arg119. Both copies of F7.scFv were fully modeled with the exception of the (GGGGS)3-linker. In the structure of mLAG3D12, one protomer model lacks the residues between Pro71-Pro87 while the other one has a larger gap between Ser69-Pro92. In the structure of hLAG3D34:F7, the more complete copy of hLAG3D34 was fully built only except for the C-terminal loop spanning from Ala435 to Leu450. The Asn218 to Ser227 was not modeled in one of the three chains from each asymmetric unit.
Structural analysis.
Buried surface areas and interface residues were determined using PDBe-PISA web server65 and manual inspection. Figures were generated in Pymol (Schrödinger)66. Relative rotating angles of D2-D2 dimers of hLAG3 and mLAG3 were measured in Pymol. The rotation angles for superimposing two protomers of hLAG3* were analyzed in Dyndom67.The Docking model of hLAG3:FGL1FD complexes was calculated from the HADDOCK2.4 server68,69.
LAG3+/NFAT luciferase assay.
To assess the potency of the F7-Fc and 15011-Fc scFvs, were administered in an NFAT-based luciferase reporter assay (LAG3/MHCII Blockade Bioassay, JA1111, Promega) following the manufacturer’s specifications. LAG3+ Jurkat T cells that were genetically modified to express an NFAT-driven luciferase reporter gene (NFAT-luc2) (J249A,Promega ), were cocultured with MHC class II-expressing Raji cells to stimulate TCR activation (J250A, Promega). On the first day, Raji cells were thawed in DMEM with 10% FBS media, premixed with the antigen peptide (K120A, Promega), seeded in tissue culture flat-bottom 96-well white plates (20,000 cells per well) and incubated for 24 hours at 37 °C, 5% CO2 humidified incubator. After 24 hours, the media was removed from the assay plate and 40 μL of antibody chimera solutions in series of concentrations (10nM, 300 nM and 1500 nM), PBS compensated media, or isotype control, were added to the assay plate. Jurkat-NFAT-LAG3 cells were thawed in RPMI 1640 media with 5% FBS and 40 μL of cells at a density of 2.5 x 10⁶ cells/ml were added to the assay plate containing antibody chimera solutions and target cells. After 5 h of incubation at 37°C, 80 μl of One-GloTM luciferase assay reagent (G719, Promega) was added to each well, followed by shaking the plate at room temperature for 10 min to lyse cells completely. Luminescence was read in a GloMax® Discover reader (Promega). The net signals were obtained by subtracting the basal signals of reference wells which contained only Jurkat-NFAT-LAG3 cells. The fold of activation was calculated by normalizing each net signal to that of the PBS compensated control. To assess the LAG3-mediated inhibitory effect of FGL1 on pMHCII-mediated T cell activation, the antibodies from above experiments were replaced with different dosages of FGL1, and the cells were co-cultured for overnight. To assess the LAG3-medfiated suppressive effect on T cell activation stimulated by anti-CD3 (eBioscience™), 40 μL of Jurkat-NFAT-LAG3 cells at a density of 2.5 x 10⁶ cells/ml were added to the assay plate, which were pre-coated with anit-CD3 antibody and contained 40 μL of RPMI media with gradient concentrations of FGL1. The cells were subsequently cultured at the incubator for overnight. To coat the 96-well plate with anti-CD3 antibody, 100 μl of 10 μg/ml OK3 (eBioscience, AB_468854) was added to each well and incubated at 37°C for 2 hours followed by PBS wash.
Immunofluorescence microscopy/Flow cytometry.
For LAG3 clustering detection, Jurkat T cells expressing LAG3 (J249A, Promega) were treated with 0, 1, 10, or 100 nM of FGL1 protein for 30 min at 37 °C. Cells were then washed once and stained with LAG3 antibody (clone BLR027F, Novus Biologicals, 1:200), followed by polyclonal donkey anti-rabbit IgG Alexa 488 secondary antibody (A21206, ThermoFisher, 1:400), fixed with BD Cytofix for 30 min and adhered to glass slides using a Shandon Cytospin. Coverslips were mounted using Antifade Mounting Medium with DAPI (Vector Labs). Images were acquired with a Leica SP8 Confocal Microscope and view using Leica Application Suite X (version 3.1.5). Definiens Developer XD was used to quantify the number of LAG3 clusters (area > 0.15 mm2) on a per cell basis (DAPI area < 25 mm2 and roundness > 1). The expression of LAG3 on the cell surface was also evaluated by flow cytometry. Briefly, cells were incubated with Zombie NIR (1/1000, BioLegend) diluted in PBS, washed once and incubated with LAG3 Antibody (clone BLR027F, Novus Biologicals, 1:200), followed by incubation with polyclonal donkey anti-rabbit IgG Alexa 488 secondary antibody (A21206, ThermoFisher, 1:400) diluted in FACS buffer, washed once and fixed with Cytofix (BD Biosciences). Data was collected with a LSRII flow cytometer (version 6.0, BD Bioscience) with analysis conducted using FlowJo (version 10.6.0, FlowJo LLC).
Extended Data
Extended Data Figure 1. Yeast display selections and protein engineering of hLAG3.
a, Yeast display selection strategy used to isolate high-affinity FGL1FD binders from the hLAG3D12 mutant library. Flow cytometry dot plots depict the first round (upper panel) and final round of selection (lower panel) stained with 100 nM FGL1FD tetramers and 20 nM FGL1FD monomers, respectively. The gating strategies for yeast and single cells were shown in the bottom. b, Mutation-frequency map generated from sequencing of the five clones isolated from the final round of yeast selection. The recurring mutation, M171I, is highlighted in blue. c, Table of clones containing the M171I mutation. d, Dose-response titrations of yeast expressing hLAG3D12 or LAG3D12 variants with biotinylated FGL1FD. e, SDS-PAGE analysis of LAG3 protein expression and secretion. Two replicated transfections were performed for hLAG3, hLAG3*, hLAG3D12, hLAG3*D12 (hLAG3D12 with M171I mutation). High-Five cells were inoculated with consistent titer of virus. After 48 hours, proteins were retrieved using Ni-NTA. Quantifications of the relative intensity of the bands (right panel) were based on triplicates inoculation.
Extended Data Figure 2. Analysis of LAG3 structures.
a, Electron density maps of hLAG3*:F7 complex structure at 3.71 Å. Upper panel: the composite omit map; lower panel: the 2Fo-Fc map from the final round of refinement. The maps were contoured at 0.8 σ. b, Alignment of D3 and D4 domains from the two protomers in the hLAG3 dimer reveals a rotation angle of 161° about the D2-D3 hinge. The two protomers are colored in cyan and grey. c, the M171I mutation and its surrounding residues in hLAG3* structure. M167 in mLAG3 is the equivalent site to M171I. f, Structural comparison of D1 domains from LAG3 (mLAG3) and CD4 (PDB ID: 3T0E). MHCII-binding residues of CD4 D1 are shown as sticks and are clustered in an analogous region to LAG3 Loop2. CD4: pink; mLAG3: green; Loop2: blue.
Extended Data Figure 3. LAG3 dimer interface and LAG3:MHCII binding analyses with SPR.
a, The 2Fo-Fc electron density map, contoured at 1.0 σ, surrounding the mLAG3 dimer interface residue Trp180. b, SPR analyses of hLAG3* binding to HLA-DR4HIV. Biotinylated HLA-DR4HIV was immobilized on a SA chip. hLAG3* protein dilutions starting from 20,000 nM were injected in turn. c-d, SPR sensorgram of recombinant mLAG3 flowed over an SA-chip immobilized with I-A(b)MOG (c) or I-A(b)CLIP (d). e, SPR analyses of LAG3 binding affinity binding to human MHCII allomorphs. MHCII proteins bound to CLIP peptides were biotinylated and immobilized on an SA chip and hLAG3* proteins were flowed over the chip. The curves were then fitted to determine the KD. Mean KD and S.D was from two independent replicates. f, Sequence alignment of the D2 dimer interface region from multiple LAG3 orthologs. Residues forming dimer contacts are outlined in red, conserved residues are highlighted in green, and biochemically similar residues are colored in green.
Extended Data Figure 4. LAG3 and MHCII protein colocalization on cell surface.
a-b, Untreated HuT 78 cells or HuT 78 cells treated with anti-CD3 (1 ug/ml), anti-CD3 /anti-CD28 (1 ug/ml) or PMA (50 ng/ml) for 48h and LAG3 expression was analyzed by flow cytometry. c, Flow cytometry analyses of HLA-DR expression on unstimulated or stimulated Hut-78 cells. The cells were stained with anti-HLA-DR (clone L243, BioLegend, 1:100). d, Subcellular localization of LAG-3 and HLA-DR on HuT-78 cells. Confocal fluorescence images displaying nuclei (blue), LAG-3 (green) and HLA-DR (red) in HuT-78 cells, either untreated or treated with anti-CD3/anti-CD28. Representative confocal images for the individual channels and merged images are shown in the zoomed panel. One of three representative experiments is shown. Horizontal bars in (b) represent the mean and statistics was determined by one-way ANOVA with P values noted in the figure.
Extended Data Figure 5. Epitope mapping and functional characterization of LAG3 antagonist antibodies.
a-c, SPR sensograms measuring hLAG3 binding to MHCII in the presence of scFv-Fc fusion proteins. d, SPR was used to determine scFv:LAG3 binding affinities. e, Flow cytometry analyses of binding of recombinant HLA-DR4HIV(4 μM) to yeast-displayed CD4 or hLAG3 and its mutants. f-g, A luciferase reporter assay was used to assess the ability of 15011-Fc to inhibit LAG3 in the presence of FGL1. To activate TCR signaling, LAG3+ Jurkat cells were either co-cultured with MHCII-expressing Raji cells (f) or stimulated with anti-CD3 (α-CD3) (g). In f and g, the cells were supplemented with 10 nM FGL1 and an isotype control antibody, 15011-Fc, or F7-Fc (300 nM). The luminescence was measured after incubating the cells overnight. In f and g, the graph represents mean ± SD of three replicates from representative of two independent experiments. All statistics was determined by one-way ANOVA, with P values noted in the figure.
Extended Data Figure 6. Mapping of FGL1 binding sites on hLAG3.
a, Flow chart depicting the selection strategy used to isolate mutations that decreased LAG3 binding to FGL1. In the first two rounds, the hLAG3D12 library was negatively selected against Alexa Fluor 647-labeled streptavidin to remove non-specific binders. In rounds 3-5, the indicated concentrations of biotinylated FGL1FD were incubated with the library and negative selections were performed to remove FGL1 binders. b, Yeast expressing LAG3 mutants were stained with MHCII tetramers (200 nM) to determine whether the FGL1 loss-of-binding mutations affected LAG3 binding to MHCII. c, SPR-sensograms recorded following the injection of samples containing fixed concentrations of hLAG3 (800 nM) and varying concentrations 15011.scFv over a chip coated with FGL1FD.
Extended Data Figure 7. Mapping the binding interface between FGL1FD and hLAG3.
a, Structural alignment of the three copies of FGL1FD (FD-a, FD-b and FD-c) in the crystal asymmetric unit. Different P subdomain loop conformations differences are depicted in the zoom panel. b, Structural alignment of fibrinogen-like domains from FGL1, Ang1 (RMSD=1.12 Å) and FIBCD1 (RMSD=1.21 Å). The FD-b protomer from the FGL1FD structure was used in this alignment. FGL1, blue; Ang1, yellow; FICD1, gray. c, Grouped residues mutated in the alanine scanning assay. Residues that were mutated in a single construct are colored accordingly. d, Flow cytometry histogram plots depicting increased binding of FGL1FD variant populations following iterative rounds of selection against hLAG3 (left) and a heat map showing the mutation frequency of amino acid substitutions after sequencing six clones (right). e, Yeast expressing hLAG3 were stained with biotinylated FGL1FD and FGL1FD containing the affinity-enhancing G290E mutation (FDG290E).
Extended Data Figure 8. FGL1-induced LAG3 clustering correlates with FGL1 suppression mechanism.
a, LAG3-NFAT Jurkat T cells were treated with 1, 10 or 100 nM of FGL1 protein and incubated for 30 min. Binding was detected using an anti-LAG3 antibody. Data reflect the mean ± SD of n=3 technical replicates, with representative of two experiments is shown. b, In the presence of the blocking antibody, 15011Fc, the FGL1-LAG3 clustering effect was diminished. Stacked confocal microscopy images displaying LAG3 (green) and DAPI (blue) in Jurkat T cells expressing LAG3, either untreated or treated with the indicated reagents: 10 nM FGL1, 15011Fc, isotype control, 10 nM FGL1 and 300 nM 15011Fc, or 10 nM FGL1 and 300 nM isotype control. c, The number of LAG3 clusters per cell was quantified and plotted as the average per field of view (FOV) with analyses of n=7 FOV from one of three representative experiments. d, NFAT luciferase reporter assay performed to assess the effect of FGL1 on LAG3-mediated suppression of T cell activation mediated by anti-CD3. The relative activation was obtained by normalizing baseline-subtracted luciferase signals of tested concentrations to the buffer control group. The graph represents mean ± SD of three independent replicates from one of two representative experiments. All significance was determined by one-way ANOVA, with P values noted in the figure.
Supplementary Material
ACKNOWLEDGEMENTS
We thank the staff at the 23-ID-D, 22-ID, and 19-ID beamlines of the Advanced Photon Source for assistance with remote X-ray data collection. We thank David Gonzalez-Perez and Elliot Medina for proofreading and thoughtful comments. The following reagents were obtained through the NIH Tetramer Core Facility: biotinylated MHCII proteins including I-A(b)MOG, I-A(b)CLIP, I-A(d) CLIP, I-A(g7) CLIP and I-E(k) CLIP, HLA-DR4CLIP, HLA-DP2clip and HLA-DQ2CLIP. V.C.L., Q.M., S.S., and C.M. are supported by a V Scholars grant from the V Foundation for Cancer Research, a Rita Allen Scholars grant, and NIH R35GM133482. G.K.A., C.W., and A.C. are supported by NIH P01AI120943. B.R. is supported by NIH/NCI R01CA230610. Support for T.H.T. and shared resources was provided by the Moffitt Cancer Center Support Grant NIH P30CA076292.
Footnotes
COMPETING INTERESTS STATEMENT
V.C.L. is a consultant on an unrelated project for Cellestia Biotech. The remaining authors have no competing interests.
DATA AVAILABILITY
All crystallography data have been deposited to the Protein Data Bank under the codes 7TZG, 7TZH, 7TZE and 7TZ2 for the structures of hLAG3*:F7, hLAG3D34:F7, mLAG3D12 and FGL1FD, respectively.
REFERENCES
- 1.Robert C A decade of immune-checkpoint inhibitors in cancer therapy. Nat Commun 11, 3801 (2020). [DOI] [PMC free article] [PubMed] [Google Scholar]
- 2.Topalian SL, Taube JM, Anders RA & Pardoll DM Mechanism-driven biomarkers to guide immune checkpoint blockade in cancer therapy. Nat Rev Cancer 16, 275–287 (2016). [DOI] [PMC free article] [PubMed] [Google Scholar]
- 3.Okazaki T, Chikuma S, Iwai Y, Fagarasan S & Honjo T A rheostat for immune responses: the unique properties of PD-1 and their advantages for clinical application. Nat Immunol 14, 1212–1218 (2013). [DOI] [PubMed] [Google Scholar]
- 4.Nguyen LT & Ohashi PS Clinical blockade of PD1 and LAG3 — potential mechanisms of action. Nat Rev Immunol 15, 45–56 (2015). [DOI] [PubMed] [Google Scholar]
- 5.Lui Y & Davis SJ LAG-3: a very singular immune checkpoint. Nat Immunol 19, 1278–1279 (2018). [DOI] [PMC free article] [PubMed] [Google Scholar]
- 6.Lecocq Q, Keyaerts M, Devoogdt N & Breckpot K The Next-Generation Immune Checkpoint LAG-3 and Its Therapeutic Potential in Oncology: Third Time’s a Charm. Int J Mol Sci 22, E75 (2020). [DOI] [PMC free article] [PubMed] [Google Scholar]
- 7.Okazaki T et al. PD-1 and LAG-3 inhibitory co-receptors act synergistically to prevent autoimmunity in mice. Journal of Experimental Medicine 208, 395–407 (2011). [DOI] [PMC free article] [PubMed] [Google Scholar]
- 8.Zhang Q et al. LAG-3 limits regulatory T cell proliferation and function in autoimmune diabetes. Sci Immunol 2, eaah4569 (2017). [DOI] [PMC free article] [PubMed] [Google Scholar]
- 9.Andrews LP et al. Resistance to PD1 blockade in the absence of metalloprotease-mediated LAG3 shedding. Science Immunology 5, eabc2728 (2020). [DOI] [PMC free article] [PubMed] [Google Scholar]
- 10.Takamatsu K et al. Profiling the inhibitory receptors LAG-3, TIM-3, and TIGIT in renal cell carcinoma reveals malignancy. Nat Commun 12, 5547 (2021). [DOI] [PMC free article] [PubMed] [Google Scholar]
- 11.Incyte Corporation. A Phase 1-2 Study of Combination Therapy With INCMGA00012 (Anti-PD-1), INCAGN02385 (Anti-LAG-3), and INCAGN02390 (Anti-TIM-3) in Participants With Select Advanced Malignancies. https://clinicaltrials.gov/ct2/show/NCT04370704 (2021). [Google Scholar]
- 12.Yap TA et al. A first-in-human phase I study of FS118, an anti-LAG-3/PD-L1 bispecific antibody in patients with solid tumors that have progressed on prior PD-1/PD-L1 therapy. JCO 37, TPS2652–TPS2652 (2019). [Google Scholar]
- 13.Roche Hoffmann-La. An Open Label, Multicenter, Dose Escalation, Phase 1 Study to Evaluate Safety/Tolerability, Pharmacokinetics, Pharmacodynamics and Preliminary Anti Tumor Activity of RO7247669, a PD1-LAG3 Bispecific Antibody, in Patients With Advanced and/or Metastatic Solid Tumors. https://clinicaltrials.gov/ct2/show/NCT04140500 (2021). [Google Scholar]
- 14.Multiple Myeloma Research Consortium. A Phase I/II Assessment of Combination Immuno-Oncology Drugs Elotuzumab, Anti-LAG-3 (BMS-986016) and Anti-TIGIT (BMS-986207). https://clinicaltrials.gov/ct2/show/NCT04150965 (2021). [Google Scholar]
- 15.Tawbi HA et al. Relatlimab and Nivolumab versus Nivolumab in Untreated Advanced Melanoma. N Engl J Med 386, 24–34 (2022). [DOI] [PMC free article] [PubMed] [Google Scholar]
- 16.Grebinoski S & Vignali DA Inhibitory receptor agonists: the future of autoimmune disease therapeutics? Current Opinion in Immunology 67, 1–9 (2020). [DOI] [PMC free article] [PubMed] [Google Scholar]
- 17.Kadowaki A et al. Gut environment-induced intraepithelial autoreactive CD4 + T cells suppress central nervous system autoimmunity via LAG-3. Nature Communications 7, 11639 (2016). [DOI] [PMC free article] [PubMed] [Google Scholar]
- 18.Angin M, Brignone C & Triebel F A LAG-3–Specific Agonist Antibody for the Treatment of T Cell–Induced Autoimmune Diseases. The Journal of Immunology 204, 810–818 (2020). [DOI] [PubMed] [Google Scholar]
- 19.Huard B, Prigent P, Tournier M, Bruniquel D & Triebel F CD4/major histocompatibility complex class II interaction analyzed with CD4- and lymphocyte activation gene-3 (LAG-3)-Ig fusion proteins. Eur. J. Immunol 25, 2718–2721 (1995). [DOI] [PubMed] [Google Scholar]
- 20.Miceli MC & Parnes JR The roles of CD4 and CD8 in T cell activation. Semin. Immunol 3, 133–141 (1991). [PubMed] [Google Scholar]
- 21.Maruhashi T, Sugiura D, Okazaki I & Okazaki T LAG-3: from molecular functions to clinical applications. J Immunother Cancer 8, e001014 (2020). [DOI] [PMC free article] [PubMed] [Google Scholar]
- 22.Hannier S, Tournier M, Bismuth G & Triebel F CD3/TCR complex-associated lymphocyte activation gene-3 molecules inhibit CD3/TCR signaling. J. Immunol 161, 4058–4065 (1998). [PubMed] [Google Scholar]
- 23.Bhagwat B et al. Establishment of engineered cell-based assays mediating LAG3 and PD1 immune suppression enables potency measurement of blocking antibodies and assessment of signal transduction. Journal of Immunological Methods 456, 7–14 (2018). [DOI] [PubMed] [Google Scholar]
- 24.Workman CJ, Dugger KJ & Vignali DAA Cutting edge: molecular analysis of the negative regulatory function of lymphocyte activation gene-3. J. Immunol 169, 5392–5395 (2002). [DOI] [PubMed] [Google Scholar]
- 25.Maeda TK, Sugiura D, Okazaki I, Maruhashi T & Okazaki T Atypical motifs in the cytoplasmic region of the inhibitory immune co-receptor LAG-3 inhibit T cell activation. Journal of Biological Chemistry 294, 6017–6026 (2019). [DOI] [PMC free article] [PubMed] [Google Scholar]
- 26.Huard B, Tournier M, Hercend T, Triebel F & Faure F Lymphocyte-activation gene 3/major histocompatibility complex class II interaction modulates the antigenic response of CD4+ T lymphocytes. Eur. J. Immunol 24, 3216–3221 (1994). [DOI] [PubMed] [Google Scholar]
- 27.Weber S & Karjalainen K Mouse CD4 binds MHC class II with extremely low affinity. Int. Immunol 5, 695–698 (1993). [DOI] [PubMed] [Google Scholar]
- 28.Maruhashi T et al. LAG-3 inhibits the activation of CD4 + T cells that recognize stable pMHCII through its conformation-dependent recognition of pMHCII. Nature Immunology 19, 1415–1426 (2018). [DOI] [PubMed] [Google Scholar]
- 29.Huard B et al. Characterization of the major histocompatibility complex class II binding site on LAG-3 protein. Proc Natl Acad Sci U S A 94, 5744–5749 (1997). [DOI] [PMC free article] [PubMed] [Google Scholar]
- 30.Graydon CG, Mohideen S & Fowke KR LAG3’s Enigmatic Mechanism of Action. Frontiers in Immunology 11, 3444 (2021). [DOI] [PMC free article] [PubMed] [Google Scholar]
- 31.Wang J et al. Fibrinogen-like Protein 1 Is a Major Immune Inhibitory Ligand of LAG-3. Cell 176, 334–347.e12 (2019). [DOI] [PMC free article] [PubMed] [Google Scholar]
- 32.Xu F et al. LSECtin Expressed on Melanoma Cells Promotes Tumor Progression by Inhibiting Antitumor T-cell Responses. Cancer Res 74, 3418–3428 (2014). [DOI] [PubMed] [Google Scholar]
- 33.Kouo T et al. Galectin-3 Shapes Antitumor Immune Responses by Suppressing CD8+ T Cells via LAG-3 and Inhibiting Expansion of Plasmacytoid Dendritic Cells. Cancer Immunol Res 3, 412–423 (2015). [DOI] [PMC free article] [PubMed] [Google Scholar]
- 34.Mao X et al. Pathological α-synuclein transmission initiated by binding lymphocyte-activation gene 3. Science 353, aah3374 (2016). [DOI] [PMC free article] [PubMed] [Google Scholar]
- 35.Zhang S et al. Mechanistic basis for receptor-mediated pathological α-synuclein fibril cell-to-cell transmission in Parkinson’s disease. PNAS 118, (2021). [DOI] [PMC free article] [PubMed] [Google Scholar]
- 36.Mao X et al. Aplp1 and the Aplp1-Lag3 Complex facilitates transmission of pathologic α-synuclein. Preprint at https://www.biorxiv.org/content/10.1101/2021.05.01.442157v1 (2021). [Google Scholar]
- 37.Ascione A et al. Development of a novel human phage display-derived anti-LAG3 scFv antibody targeting CD8+ T lymphocyte exhaustion. BMC Biotechnology 19, 67 (2019). [DOI] [PMC free article] [PubMed] [Google Scholar]
- 38.Guy HR Amino acid side-chain partition energies and distribution of residues in soluble proteins. Biophys J 47, 61–70 (1985). [DOI] [PMC free article] [PubMed] [Google Scholar]
- 39.Ohmura T, Ueda T, Hashimoto Y & Imoto T Tolerance of point substitution of methionine for isoleucine in hen egg white lysozyme. Protein Engineering, Design and Selection 14, 421–425 (2001). [DOI] [PubMed] [Google Scholar]
- 40.Wang J et al. Crystal structure of the human CD4 N-terminal two-domain fragment complexed to a class II MHC molecule. PNAS 98, 10799–10804 (2001). [DOI] [PMC free article] [PubMed] [Google Scholar]
- 41.Li N, Workman CJ, Martin SM & Vignali DAA Biochemical Analysis of the Regulatory T Cell Protein Lymphocyte Activation Gene-3 (LAG-3; CD223). The Journal of Immunology 173, 6806–6812 (2004). [DOI] [PubMed] [Google Scholar]
- 42.Su LF, Del Alcazar D, Stelekati E, Wherry EJ & Davis MM Antigen exposure shapes the ratio between antigen-specific Tregs and conventional T cells in human peripheral blood. Proc Natl Acad Sci U S A 113, E6192–E6198 (2016). [DOI] [PMC free article] [PubMed] [Google Scholar]
- 43.Mendel Kerlero de Rosbo N & Ben-Nun A Delineation of the minimal encephalitogenic epitope within the immunodominant region of myelin oligodendrocyte glycoprotein: diverse V beta gene usage by T cells recognizing the core epitope encephalitogenic for T cell receptor V beta b and T cell receptor V beta a H-2b mice. Eur J Immunol 26, 2470–2479 (1996). [DOI] [PubMed] [Google Scholar]
- 44.Petersen TR et al. Characterization of MHC- and TCR-binding residues of the myelin oligodendrocyte glycoprotein 38–51 peptide. European Journal of Immunology 34, 165–173 (2004). [DOI] [PubMed] [Google Scholar]
- 45.MacLachlan BJ et al. Molecular characterization of HLA class II binding to the LAG-3 T cell co-inhibitory receptor. European Journal of Immunology 51, 331–341 (2021). [DOI] [PMC free article] [PubMed] [Google Scholar]
- 46.Holling TM, Schooten E, Langerak AW & van den Elsen PJ Regulation of MHC class II expression in human T-cell malignancies. Blood 103, 1438–1444 (2004). [DOI] [PubMed] [Google Scholar]
- 47.Grandal MM et al. Anti-lag-3 antibodies and compositions. WIPO(PCT) Patent No. US20220056126A3 (2019).
- 48.Krissinel E & Henrick K Secondary-structure matching (SSM), a new tool for fast protein structure alignment in three dimensions. Acta Crystallogr D Biol Crystallogr 60, 2256–2268 (2004). [DOI] [PubMed] [Google Scholar]
- 49.Shrive AK et al. Crystal Structure of the Tetrameric Fibrinogen-like Recognition Domain of Fibrinogen C Domain Containing 1 (FIBCD1) Protein. J Biol Chem 289, 2880–2887 (2014). [DOI] [PMC free article] [PubMed] [Google Scholar]
- 50.Leppänen V-M, Saharinen P & Alitalo K Structural basis of Tie2 activation and Tie2/Tie1 heterodimerization. PNAS 114, 4376–4381 (2017). [DOI] [PMC free article] [PubMed] [Google Scholar]
- 51.Nagdas SK, Winfrey VP & Olson GE Two fibrinogen-like proteins, FGL1 and FGL2 are disulfide-linked subunits of oligomers that specifically bind nonviable spermatozoa. The International Journal of Biochemistry & Cell Biology 80, 163–172 (2016). [DOI] [PubMed] [Google Scholar]
- 52.Mohan K et al. Topological control of cytokine receptor signaling induces differential effects in hematopoiesis. Science 364, eaav7532 (2019). [DOI] [PMC free article] [PubMed] [Google Scholar]
- 53.Freed DM, Alvarado D & Lemmon MA Ligand regulation of a constitutively dimeric EGF receptor. Nat Commun 6, 7380 (2015). [DOI] [PMC free article] [PubMed] [Google Scholar]
- 54.Moore JO, Lemmon MA & Ferguson KM Dimerization of Tie2 mediated by its membrane-proximal FNIII domains. Proc Natl Acad Sci U S A 114, 4382–4387 (2017). [DOI] [PMC free article] [PubMed] [Google Scholar]
- 55.Iouzalen N, Andreae S, Hannier S & Triebel F LAP, a lymphocyte activation gene-3 (LAG-3)-associated protein that binds to a repeated EP motif in the intracellular region of LAG-3, may participate in the down-regulation of the CD3/TCR activation pathway. Eur. J. Immunol 31, 2885–2891 (2001). [DOI] [PubMed] [Google Scholar]
- 56.Liu Z & Ukomadu C Fibrinogen–like–protein 1, a hepatocyte derived protein is an acute phase reactant. Biochem Biophys Res Commun 365, 729–734 (2008). [DOI] [PMC free article] [PubMed] [Google Scholar]
METHODS-ONLY REFERENCES
- 57.Kabsch W Integration, scaling, space-group assignment and post-refinement. Acta Cryst D 66, 133–144 (2010). [DOI] [PMC free article] [PubMed] [Google Scholar]
- 58.Otwinowski Z & Minor W [20] Processing of X-ray diffraction data collected in oscillation mode. in Methods in Enzymology 276, 307–326 (1997). [DOI] [PubMed] [Google Scholar]
- 59.Minor W, Cymborowski M, Otwinowski Z & Chruszcz M HKL −3000: the integration of data reduction and structure solution – from diffraction images to an initial model in minutes. Acta Crystallogr D Biol Crystallogr 62, 859–866 (2006). [DOI] [PubMed] [Google Scholar]
- 60.McCoy AJ et al. Phaser crystallographic software. J Appl Crystallogr 40, 658–674 (2007). [DOI] [PMC free article] [PubMed] [Google Scholar]
- 61.Kelley LA, Mezulis S, Yates CM, Wass MN & Sternberg MJE The Phyre2 web portal for protein modeling, prediction, and analysis. Nat Protoc 10, 845–858 (2015). [DOI] [PMC free article] [PubMed] [Google Scholar]
- 62.Adams PD et al. PHENIX: a comprehensive Python-based system for macromolecular structure solution. Acta Crystallogr. D Biol. Crystallogr 66, 213–221 (2010). [DOI] [PMC free article] [PubMed] [Google Scholar]
- 63.Afonine PV et al. Towards automated crystallographic structure refinement with phenix.refine. Acta Cryst D 68, 352–367 (2012). [DOI] [PMC free article] [PubMed] [Google Scholar]
- 64.Emsley P & Cowtan K Coot: model-building tools for molecular graphics. Acta Crystallogr. D Biol. Crystallogr 60, 2126–2132 (2004). [DOI] [PubMed] [Google Scholar]
- 65.Krissinel E & Henrick K Inference of macromolecular assemblies from crystalline state. J. Mol. Biol 372, 774–797 (2007). [DOI] [PubMed] [Google Scholar]
- 66.The PyMOL Molecular Graphics System. (Schrödinger, LLC; ). [Google Scholar]
Associated Data
This section collects any data citations, data availability statements, or supplementary materials included in this article.
Supplementary Materials
Data Availability Statement
All crystallography data have been deposited to the Protein Data Bank under the codes 7TZG, 7TZH, 7TZE and 7TZ2 for the structures of hLAG3*:F7, hLAG3D34:F7, mLAG3D12 and FGL1FD, respectively.


