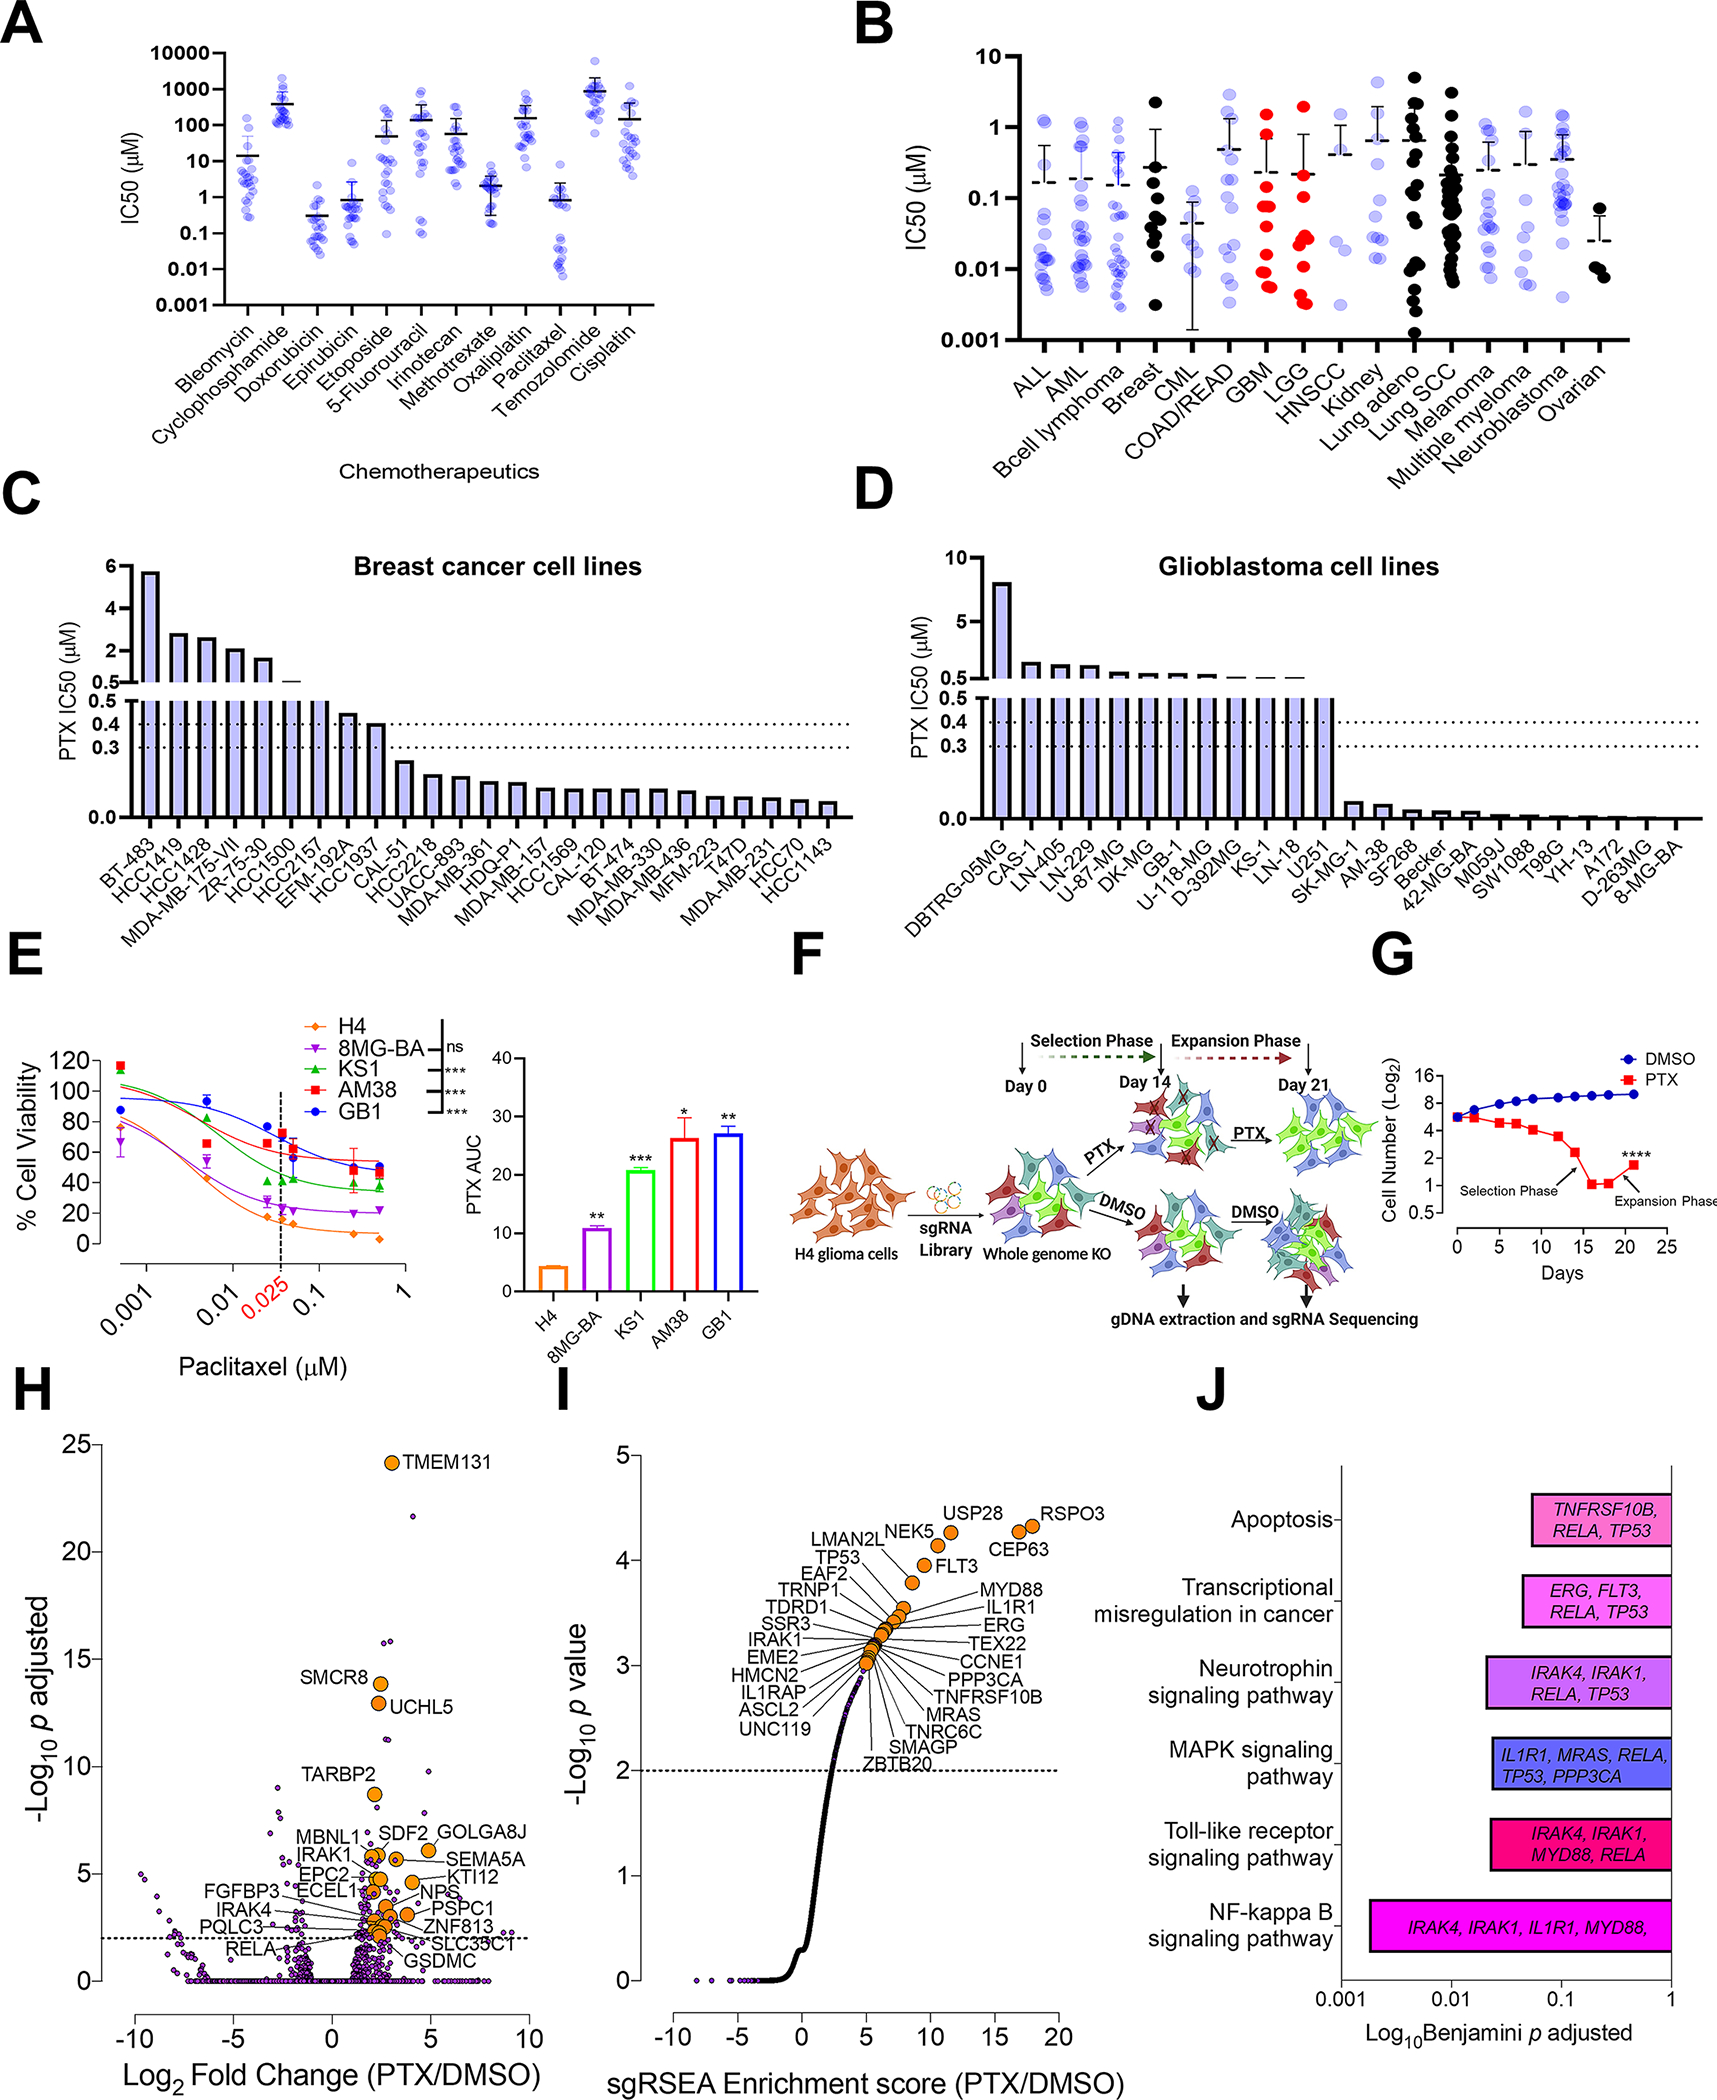
Fig. 1. Whole genome CRISPR screen reveals genes that confer susceptibility to PTX treatment.

A, Comparison of IC50 drug concentrations of the commonly used chemotherapeutics against glioma cell lines from Sanger database (n=24). B, Comparison of PTX IC50 concentrations against all the available cancer cell lines (n=268) from Sanger database. On the graph-ALL (acute lymphoblastic leukemia), AML (acute myeloid leukemia), CML (chronic myelogenous leukemia), COAD (colon adenocarcinoma), READ (rectum adenocarcinoma), GBM (glioblastoma), LGG (low grade glioma), HNSCC (head and neck squamous cell carcinoma) and Lung SCC (lung squamous cell carcinoma). Colored in black are the IC50 drug concentrations of PTX for the cancers commonly treated with PTX. Colored in red are LGG’s and GBM’s. Histogram showing PTX IC50 drug concentrations for C, breast cancer and D, glioma cell lines from Sanger database. The dotted line indicates the brain PTX concentration (0.3–0.4 μM) that can be achieved by US-mediated delivery of PTX in the mouse brain (6). Graphs from A, B, C and D are generated using data from Sanger database (https://www.cancerrxgene.org/) (18). E, PTX dose response curve using glioma cell lines. One-way ANOVA with Dunnett’s multiple comparison test was used- ***p < 0.001, ns=non-significant. The histogram alongside shows the Area under curve (AUC) for each of these cell lines. Unpaired two-tailed t test was used for the analysis comparing most sensitive H4 cell line with other cell lines- *p< 0.05; **p< 0.01, ***p< 0.001. The experiment was repeated twice in triplicates. H4 cell line showed the highest degree of sensitivity to PTX hence was selected for the PTX CRISPR screen. F, Schematic representation of CRISPR screen. H4 cells were transduced with a genome-scale gRNA library (four gRNAs/gene). The edited cells were called as (Day 0). These cells were subjected to PTX (0.025 μM) or vehicle (DMSO) treatment. Cells from both these groups were sampled at D14 and D21 for Illumina sequencing of gRNA. G, Graphical representation depicting number of live cells (Y) during the CRISPR screen in PTX treated and DMSO control groups. Unpaired two-tailed t test was used for the analysis- ****p< 0.0001. H, Deseq analysis shows top genes (orange) for enriched gRNAs from PTX screen. Dashed line indicates p<0.05. Grey dots are all the genes with p>0.05. I, sgRSEA analysis shows top genes (orange) for enriched gRNAs from PTX screen. Dashed line indicates a p<0.05. Grey continuous line like dots are all the genes with p>0.05. J, Significantly enriched pathways along with their corresponding genes, selected in the PTX CRISPR screen. DAVID was used for gene ontology analysis (15).
