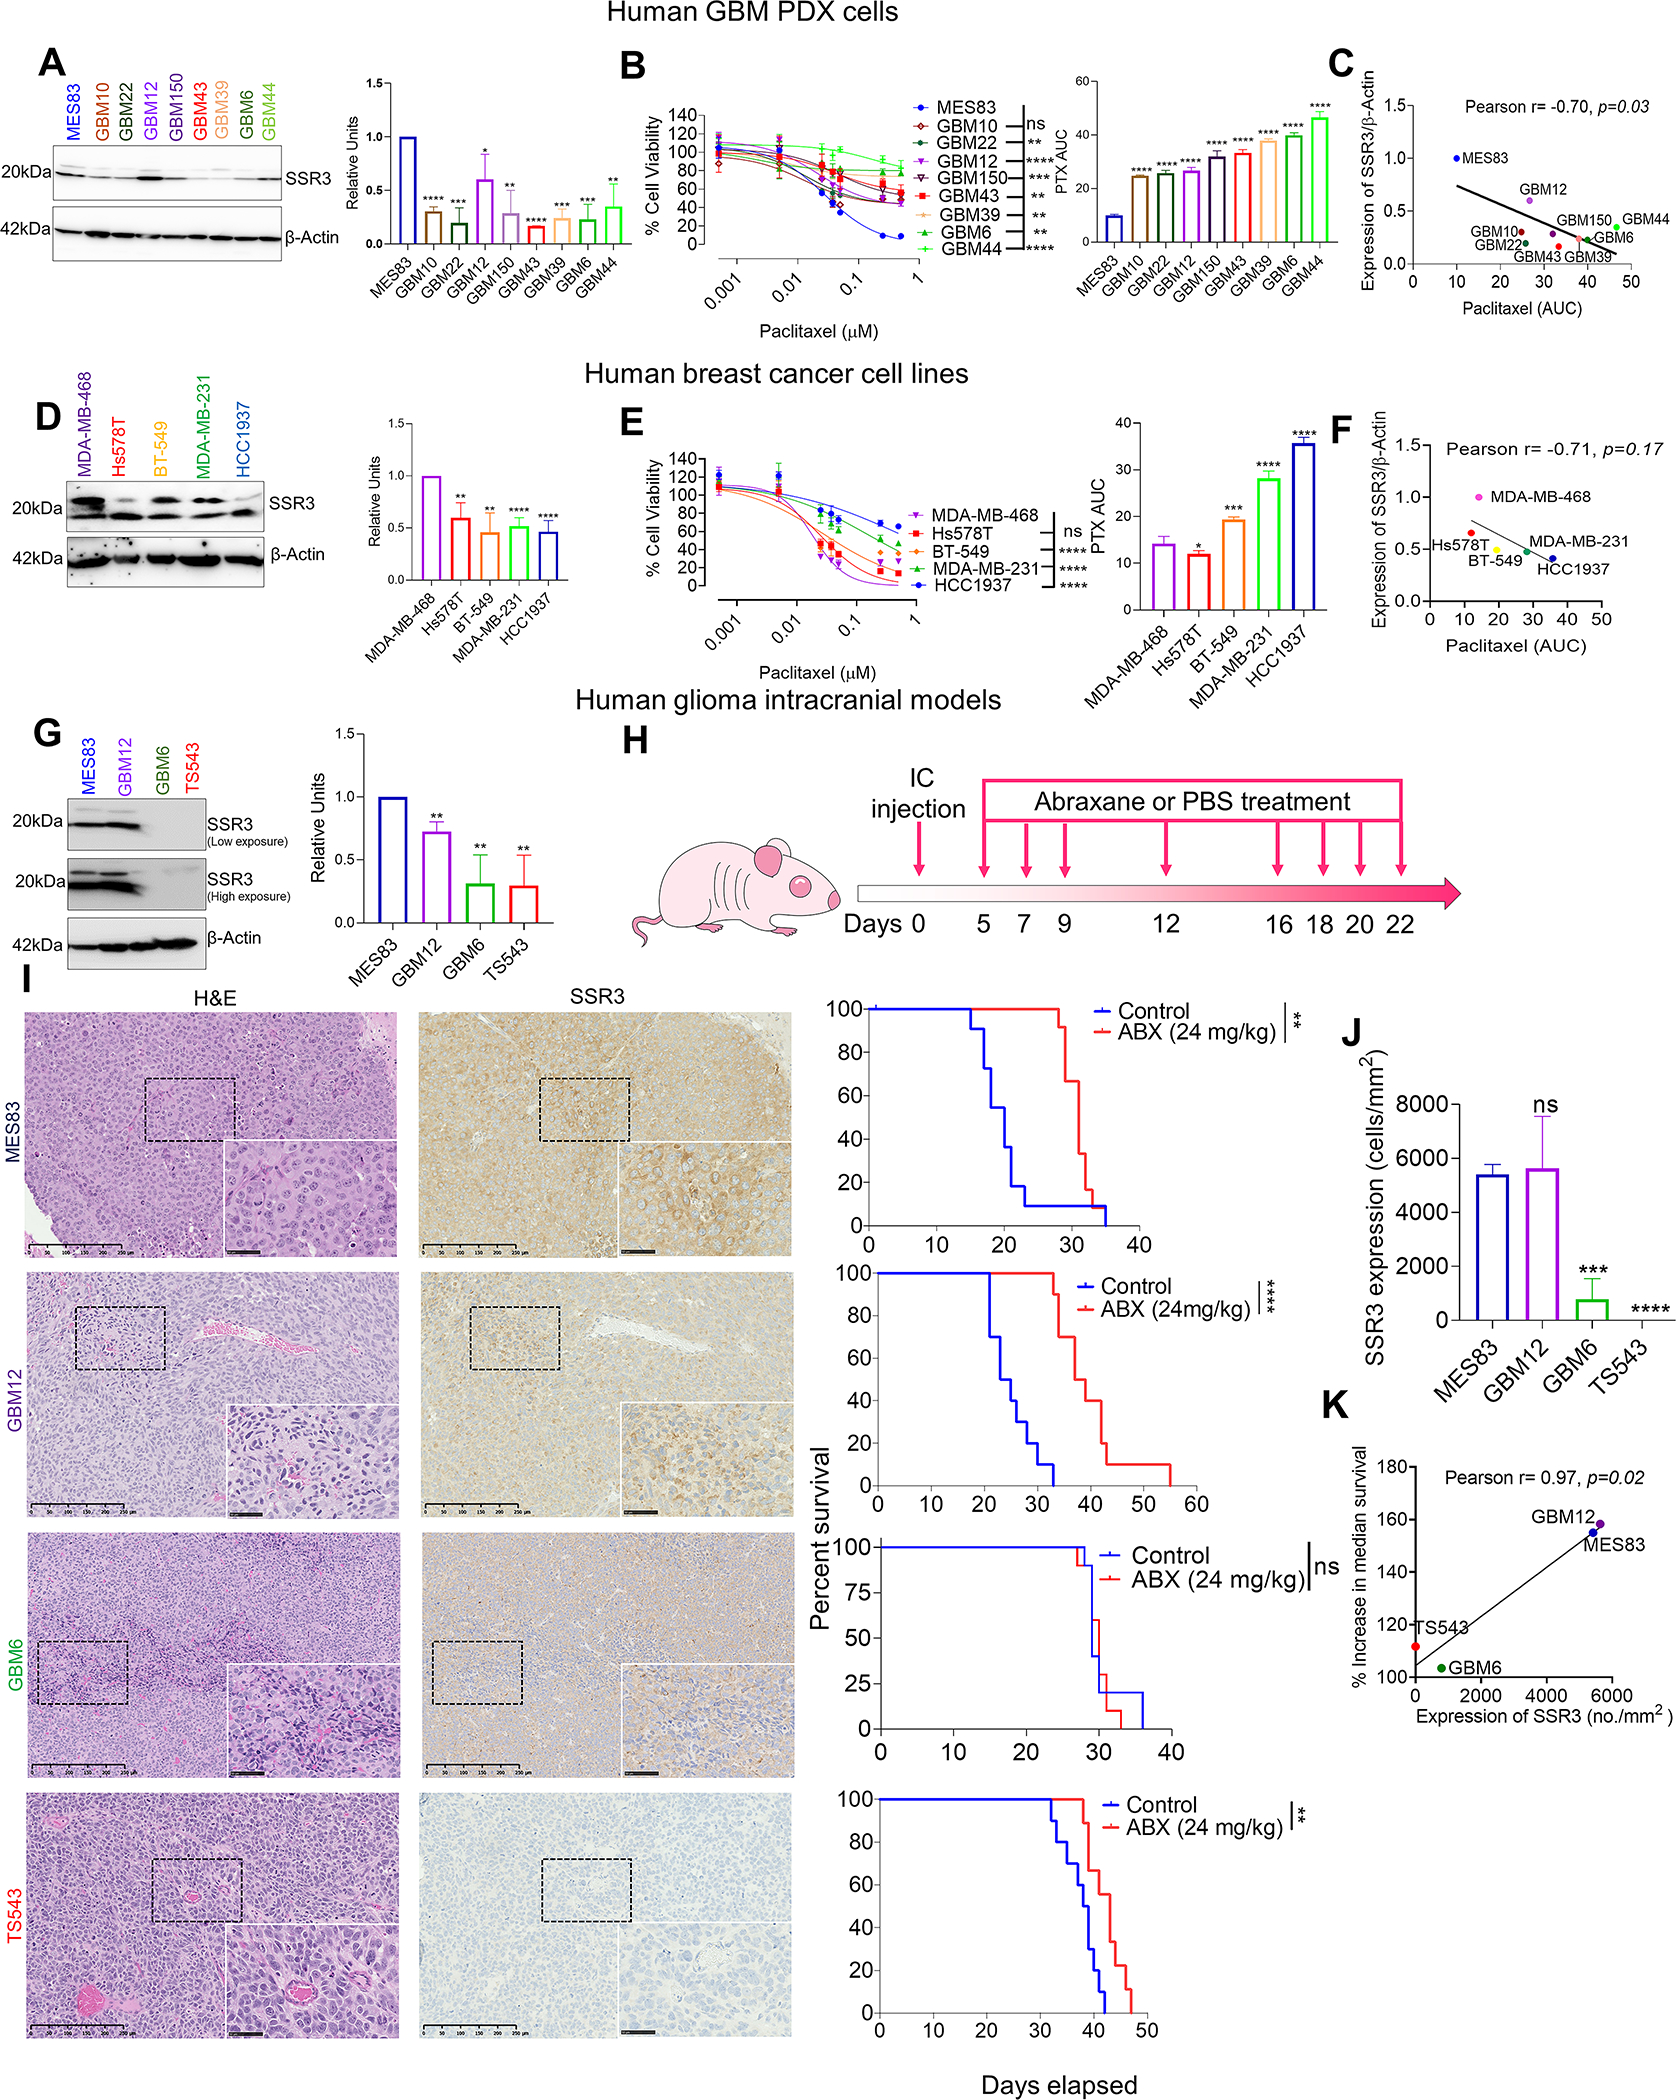
Fig. 3. SSR3 expression correlates with susceptibility to PTX in glioma, breast cancer cells and in intracranial glioma models.

A, Western blot showing SSR3 protein levels for the 9 glioma PDX cell lines. The histogram alongside western blot represents densitometry analysis (using Image J). B, PTX dose response curves for the glioma PDX cell lines. The histogram alongside shows the AUC for each of these cell lines. C, Scatter plot showing correlation between susceptibility to PTX (AUC) and protein levels of SSR3 as quantified by Image J. Pearson correlation coefficient r= −0.70, p=0.03. D, Western blot showing SSR3 protein levels for the indicated breast cancer cell lines. Histogram alongside western blot represents densitometry analysis. E, PTX dose response curves for the breast cancer cell lines. The histogram alongside shows the AUC for each of these cell lines. F, Scatter plot showing correlation between susceptibility to PTX (AUC) and protein levels of SSR3 as quantified by Image J. Pearson correlation coefficient r= −0.71, p=0.17. G, Western blot showing baseline protein levels of SSR3 in the MES83, GBM12, GBM6 and TS543 cell lines. The histogram alongside western blot represents densitometry analysis. H, Schematic representation of the dosing scheme followed to treat mice having intracranial tumors with ABX. Three PDX lines (MES83, GBM12, GBM6 and one glioma cell line (TS543) were implanted intracranially. I, Representative H and E staining and immunostaining of SSR3 on the tumor tissues from the xenografts developed from these cell lines. Scale bar in black=250 μm. Scale bar in the inset=50 μm. The survival curve alongside, shows the survival of the mice injected with these cell lines in ABX treated and control treated groups. Log-rank analysis was used to determine the survival differences. For MES83, median survival was 20 for control vs. 31 days for ABX treated group, p=0.0041, (n=12). For GBM12, median survival was 24 for control vs. 38 days for ABX treated group, p<0.0001, (n=10). For GBM6, median survival was 29 for control vs. 30 days for ABX treated group, p=0.77, n=10. For TS543, median survival was 38.5 for control vs. 43 days for ABX treated group, p=0.0050, (n=10) for control and (n=9) for ABX treated group. J, Histogram shows SSR3 protein expression (cells/mm2) in xenograft tumor tissues in the SSR3 high PTX sensitive MES83 and GBM12 and SSR3 low PTX resistant GBM6 and TS543 models. K, Scatter plot showing correlation between baseline SSR3 protein expression (cells /mm2) in xenograft tumor tissues and percent increase in median survival. Pearson correlation coefficient r= 0.97, p=0.02. Histoquest software was used to quantitate SSR3 tumor expression by setting 25 as threshold for SSR3 mean intensity using positive and negative control slides. The data represents n=3 tumors/group. For B and E PTX dose response curves-One-way ANOVA with Dunnett’s multiple comparison test was used-ns=non-significant, **p< 0.01, ***p< 0.001, ****p<0.0001. The comparison was made between the most sensitive cell lines and all the other cell lines. For the densitometry and AUC histogram in A, B, D, E, G and J-.Unpaired two-tailed t test was used for the analysis comparing most sensitive cell line with other cell lines- *p< 0.05; **p< 0.01, ***p< 0.001, ****p<0.0001. For J and K MES83, GBM12 and GBM6 (n=3 tumors/group) and for TS543 (n=2 tumors/group). All the experiments in A, B, D, E, G and J were done in triplicates. Β-actin was used as a loading control for western blots.
