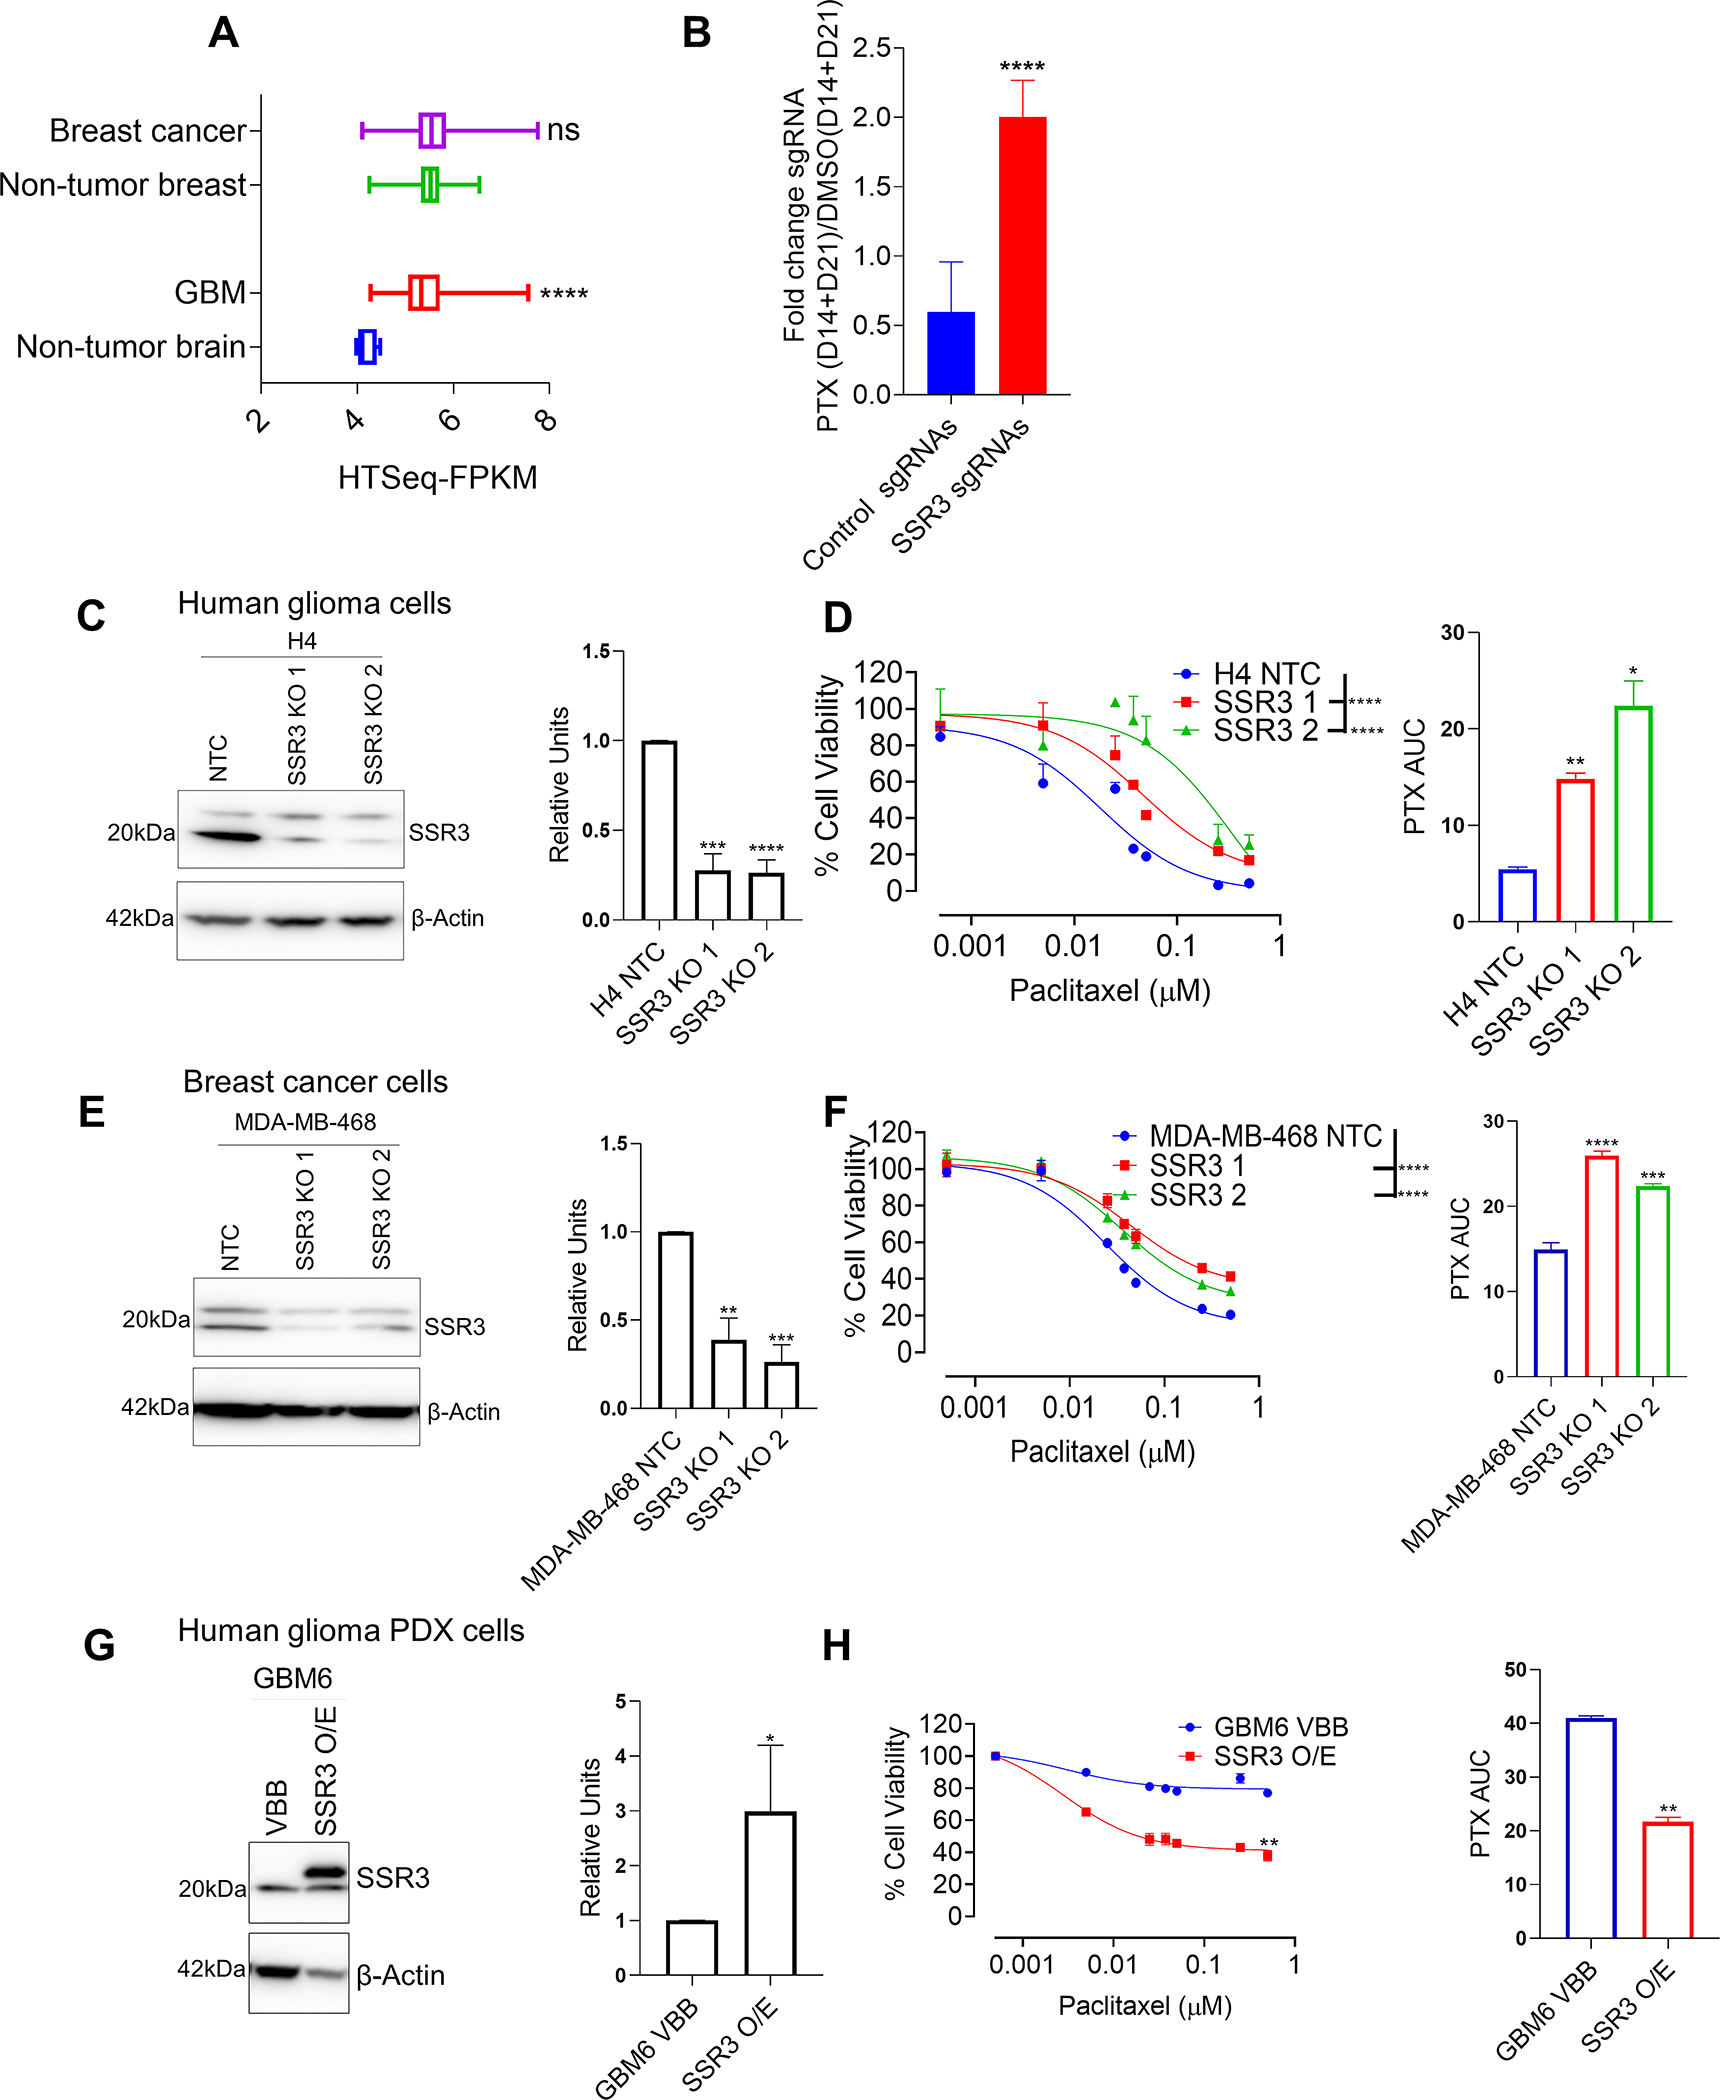
Fig. 4. SSR3 protein levels determine susceptibility to PTX in breast and GBM cell lines.

A, The graph shows SSR3 mRNA expression in GBM and breast cancers in relation to its non-tumor regions from TCGA GBM and breast cancer datasets respectively. B, The graph shows the fold enrichment of SSR3 gRNA’s (n=2) and non-targeting control gRNA’s (n=1000) in PTX treated group (D14 and D21) over DMSO control group (D14 and D21) in the CRISPR screen. Unpaired two-tailed t test was used for the analysis- ****p<0.0001. C, Western blot for SSR3 gene KO clones derived from H4 glioma cells. The histogram alongside western blot represents densitometry analysis. D, PTX dose response curve for SSR3 gene KO clones derived from H4 glioma cells. The histogram alongside shows the AUC for each of these clones. E, Western blot for SSR3 gene KO clones derived from MDA-MB 468 breast cancer cells. The histogram alongside western blot represents densitometry analysis. F, PTX dose response curve for SSR3 gene KO clones derived from MDA-MB 468 breast cancer cells. The histogram alongside shows the AUC for each of these clones. G, Western blot for SSR3 overexpressing clones derived from GBM PDX line GBM6. The histogram alongside western blot represents densitometry analysis H, PTX dose response curve for SSR3 overexpressing cells derived from GBM PDX line GBM6. The histogram alongside shows the AUC for these clones. For the densitometry and AUC histogram in C, D, E, F, G and H-Unpaired two-tailed t test was used for the analysis comparing control clones with the edited clones- *p< 0.05; **p< 0.01, ***p< 0.001, ****p<0.0001. For D and F PTX dose response curves-One-way ANOVA with Dunnett’s multiple comparison test was used- ****p<0.0001. The comparison was made between the control clones and the edited clones. For H, PTX dose response curve-Unpaired two-tailed t test was used for the analysis-**p<0.01. All the experiments in C-H were done in triplicates.
