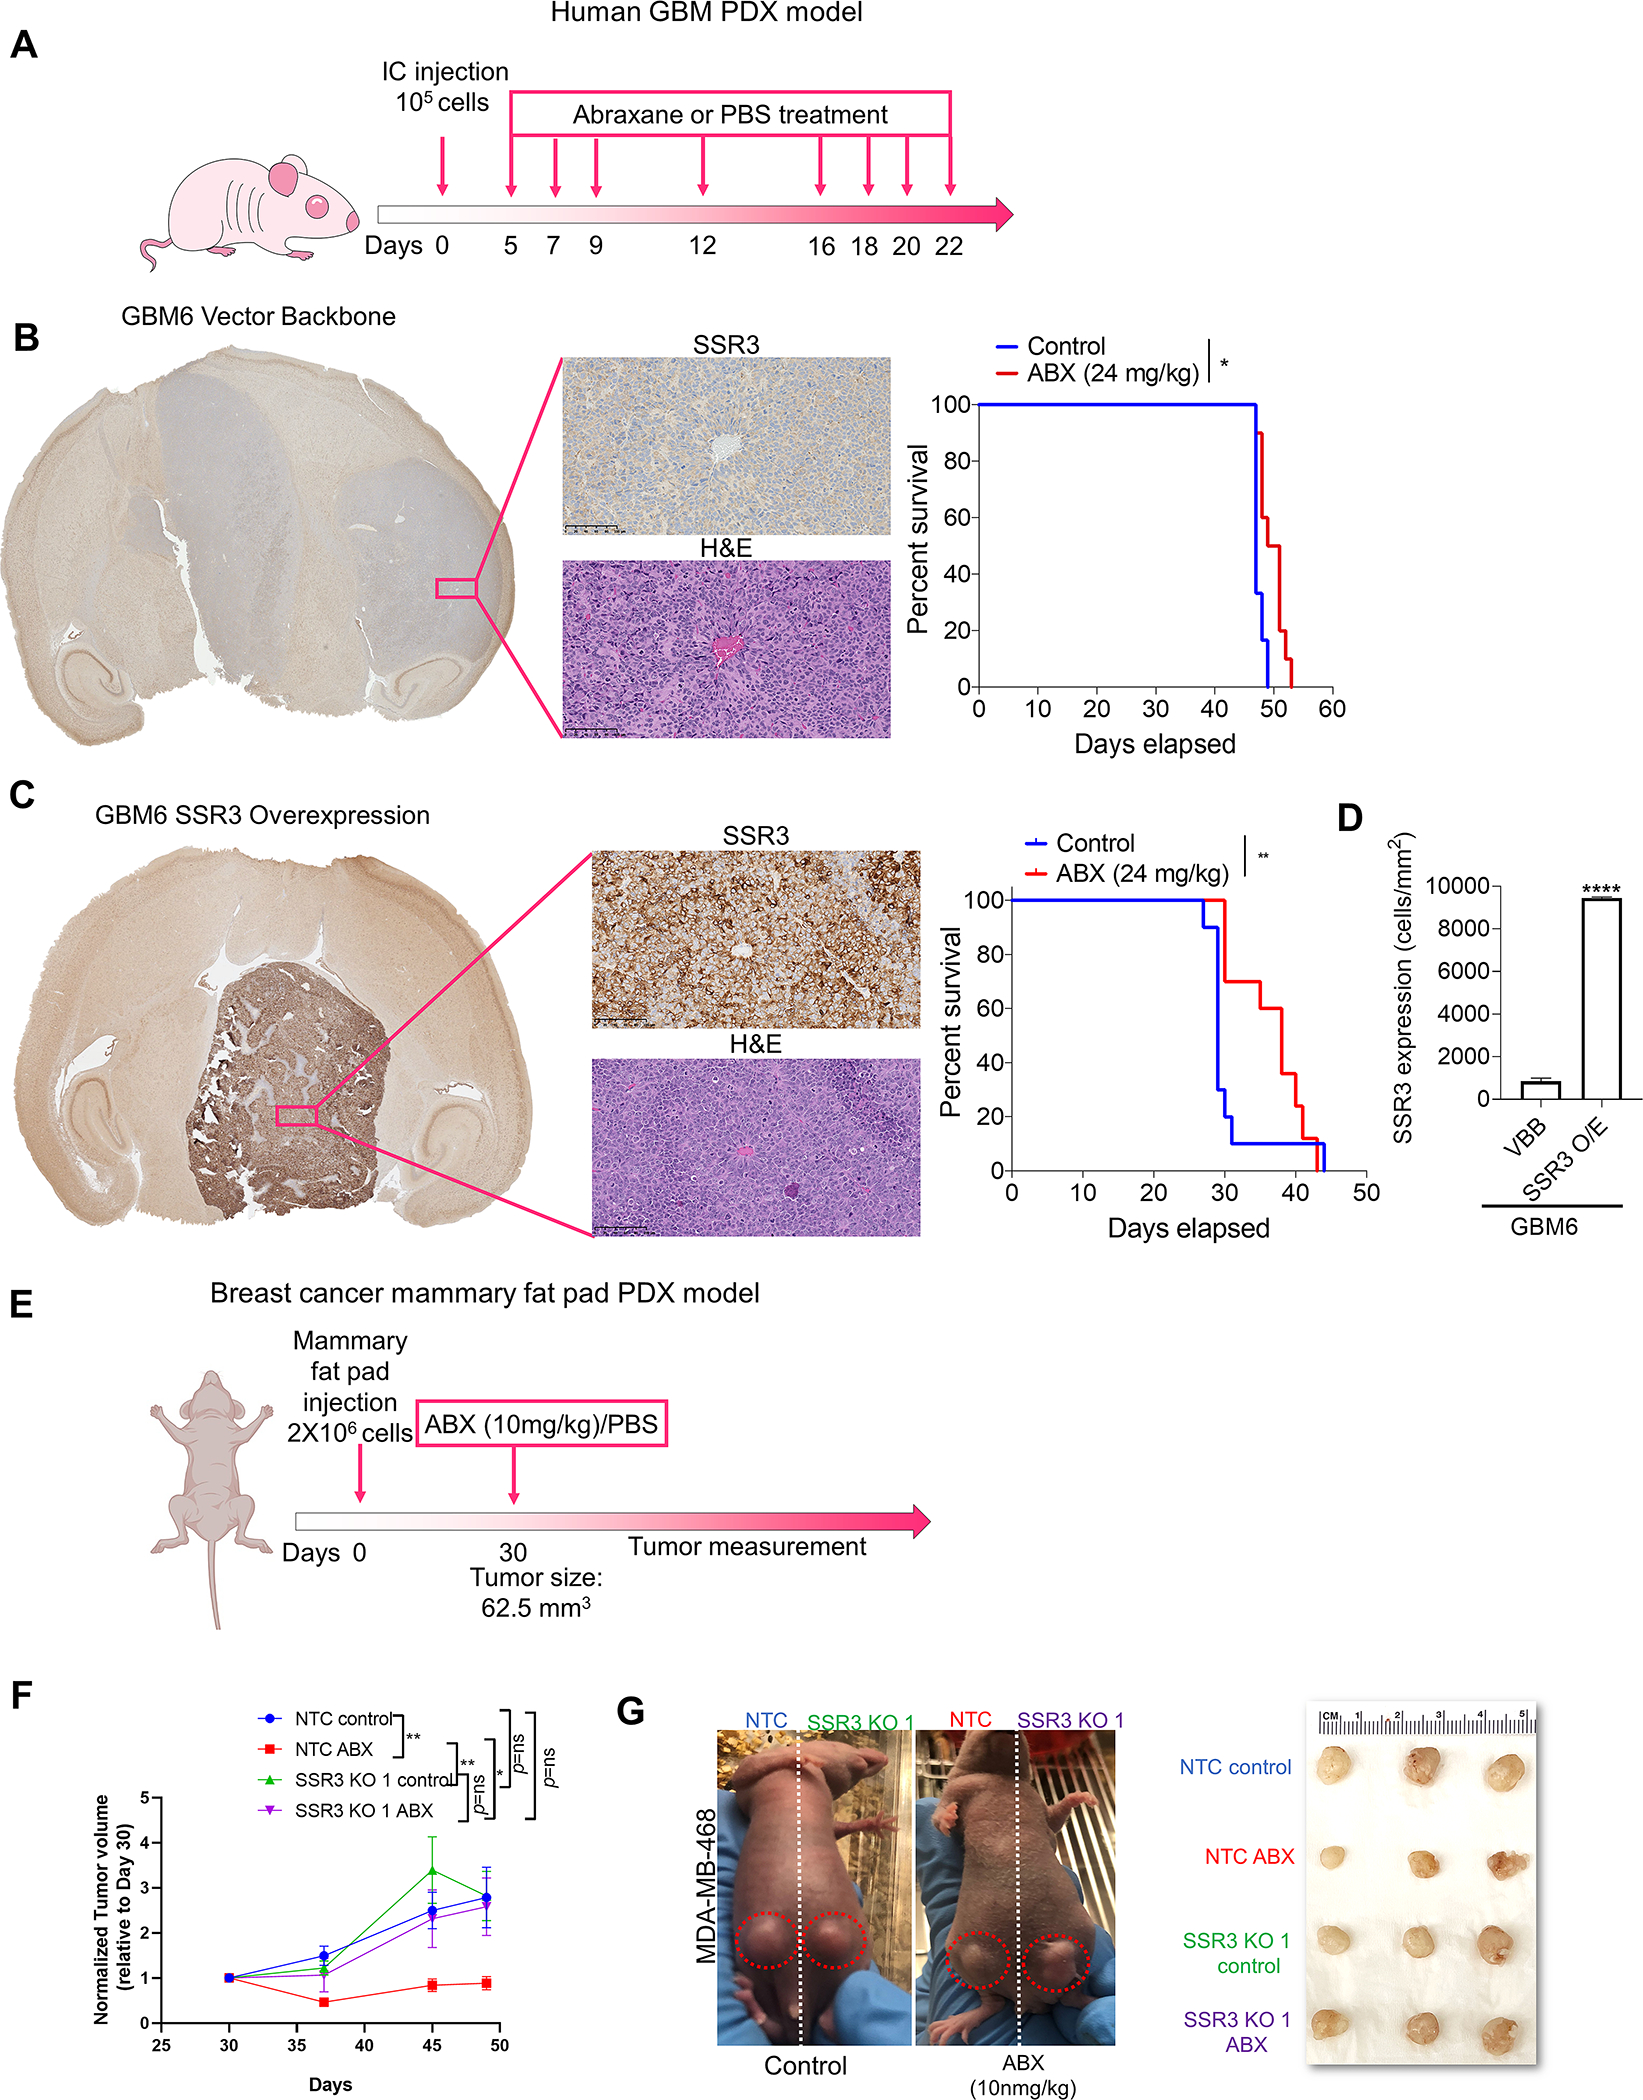
Fig. 5. SSR3 protein levels determine susceptibility to PTX in in-vivo glioma and breast cancer models.

A, Schematic representation of the dosing scheme followed to treat mice having intracranial tumors with ABX. B and C, Representative H and E staining and immunostaining of SSR3 on the tumor tissues from the xenografts developed from GBM6 vector control and SSR3 overexpressing cells respectively. Scale bar in black=100 μm. Kaplan–Meier survival curves for mice injected with vector control (GBM6 VBB) and GBM6 SSR3 overexpressing (GBM6 SSR3 O/E) clones-with and without the treatment with ABX. Log-rank analysis was used to determine the survival differences. For GBM6 VBB, median survival was 47 days for control vs. 50 days for ABX treated group, p<0.01, number of mice (n=10/group). For GBM6 SSR3 O/E, median survival was 29 for control vs. 38 days for ABX treated group, p<0.0016 (n=10/group). **p<0.01, *p<0.05. D, Histogram shows baseline SSR3 protein expression (cells/mm2) in tumor tissues from the xenografts developed from GBM6 VBB (n=2 tumors/group) and GBM6 SSR3 O/E (n=3 tumors/group) in the control group. E, Schematic representation of the dosing scheme followed to treat mice bearing mammary fat pad tumors with ABX. F, The mice were randomized on day 30 when the tumors measured 62.5 mm3. Single dose of ABX (10mg/kg) was administered to the mice in the experimental group and PBS was administered to the mice in the control group, after randomization on day 30. The tumors were measured once every week after the drug treatment (n=5/group). The data was analyzed using two-way ANOVA with Tukey’s multiple comparison test-**p<0.01, *p<0.05. G, Representative images of the mice bearing mammary fat pad tumors-injected on one side with MDA-MB-468 vector control (NTC) and on contralateral side with SSR3 KO (SSR3 KO1) clones and treated with ABX or PBS. Alongside is a photograph of the tumors from all the four groups at the endpoint.
