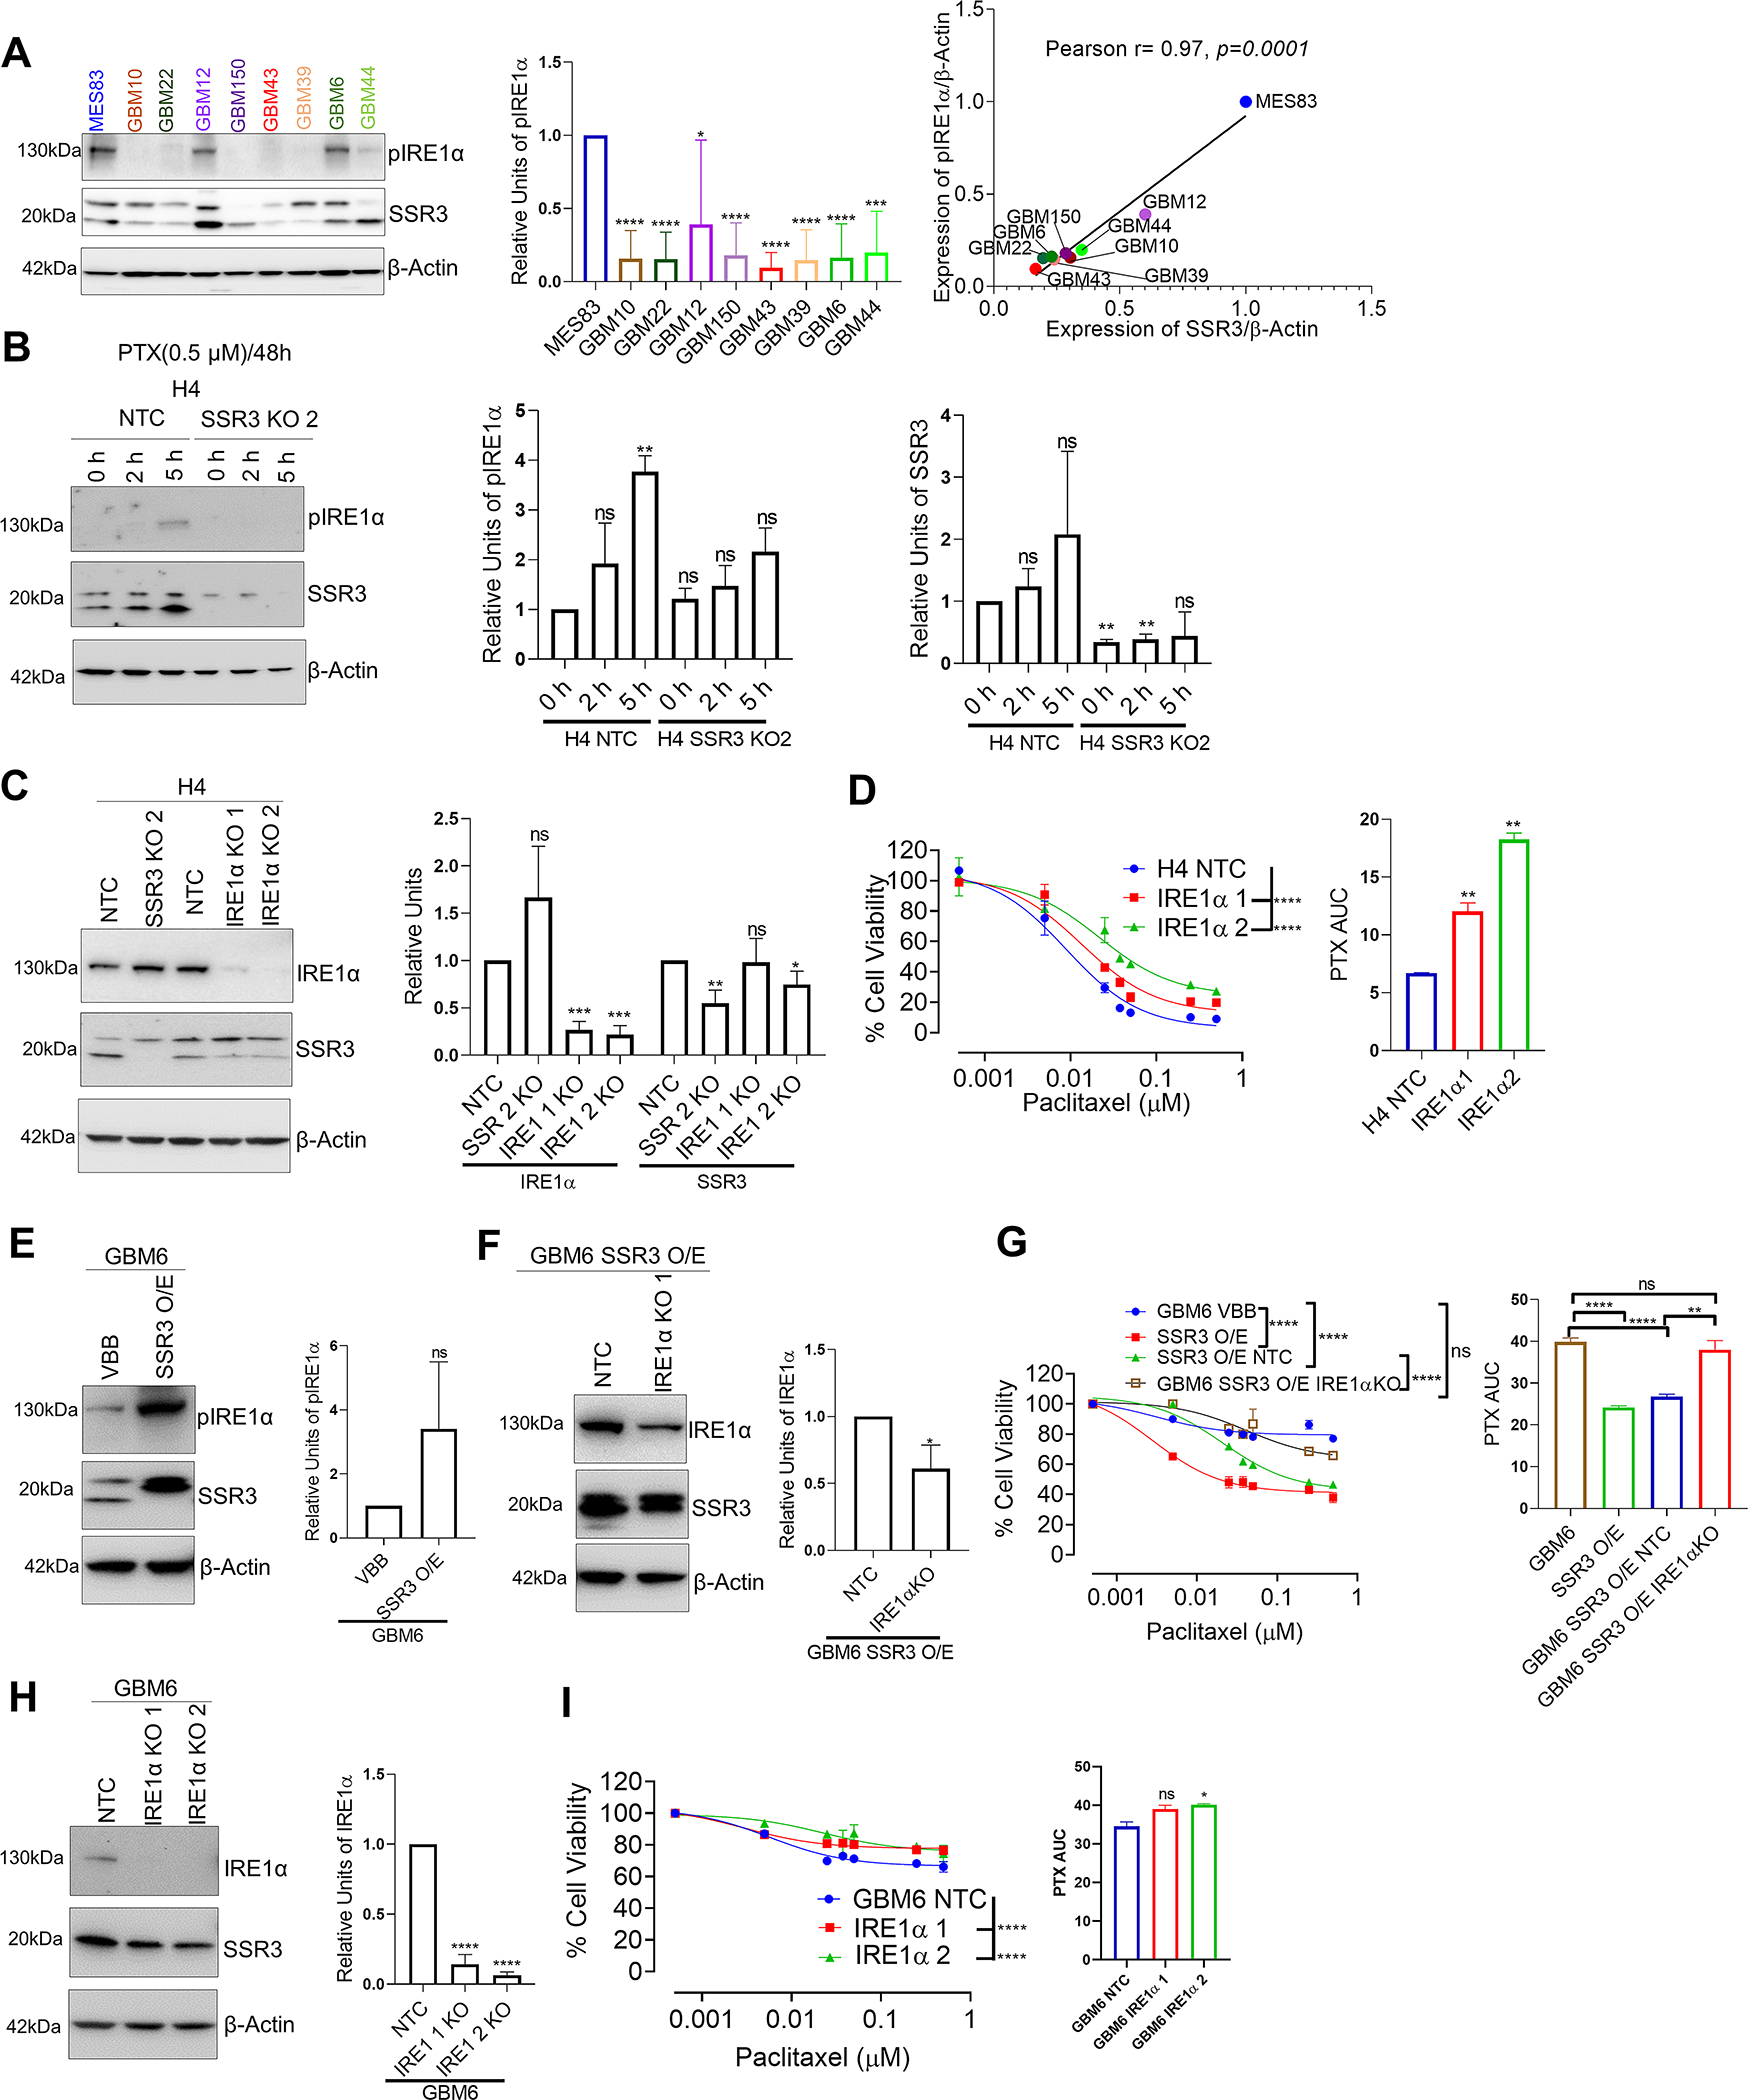
Fig. 6. SSR3 mediated susceptibility to PTX seems to be regulated through phosphorylation of IRE1α in glioma cells.

A, Western blot showing pIRE1α and SSR3 protein levels in glioma PDX cell lines. The histogram alongside western blot represents densitometry analysis. The Scatter plot shows correlation between SSR3 (from Figure 3) and pIRE1α protein levels, as quantified by Image J using data from three independent experiments. Pearson correlation coefficient r= 0.97, p=0.0001. B, Western blot showing pIRE1α levels in 0.5 μM PTX treated H4 SSR3 KO and vector control clones at 2 h and 5 h time points. The histogram alongside western blot represents densitometry analysis of 2 independent experiments for pIRE1α and SSR3. C, Western blot for IRE1α gene KO clones derived from H4 glioma cells. The histogram alongside western blot represents densitometry analysis for IRE1α and SSR3. D, PTX dose response curve for IRE1α gene KO clones derived from H4 glioma cells. The histogram alongside shows the AUC for each of these clones. E, Western blot showing pIRE1α levels in GBM6 SSR3 overexpressing and vector control clones. The histogram alongside western blot represents densitometry analysis. F, Western blot of IRE1α gene KO clones and its vector control cells derived from GBM6 SSR3 overexpressing cells. The histogram alongside western blot represents densitometry analysis for IRE1α. G, PTX dose response curve of IRE1α gene KO clones. Curves for GBM6 SSR3 overexpressing clones and GBM6 parental cells are plotted for comparison. The histogram alongside shows the AUC for each of these clones. H, Western blot of IRE1α gene KO clones and its vector control cells derived from GBM6 wild type cells. The histogram alongside western blot represents densitometry analysis for IRE1α. I, PTX dose response curve of IRE1α gene KO clones derived from GBM6 wild type cells. The histogram alongside shows the AUC for each of these clones. For the densitometry and AUC histogram in A-I -Unpaired two-tailed t test was used for the analysis comparing control clones with the edited clones- *p< 0.05; **p< 0.01, ***p< 0.001, ****p<0.0001, ns=non-significant. For D, G and I, PTX dose response curves-One-way ANOVA with Dunnett’s multiple comparison test was used- ****p<0.0001, ns=non-significant. The comparison was made between the control clones and the edited clones. All the experiments in A-I were done in triplicates.
