
Figure 9.
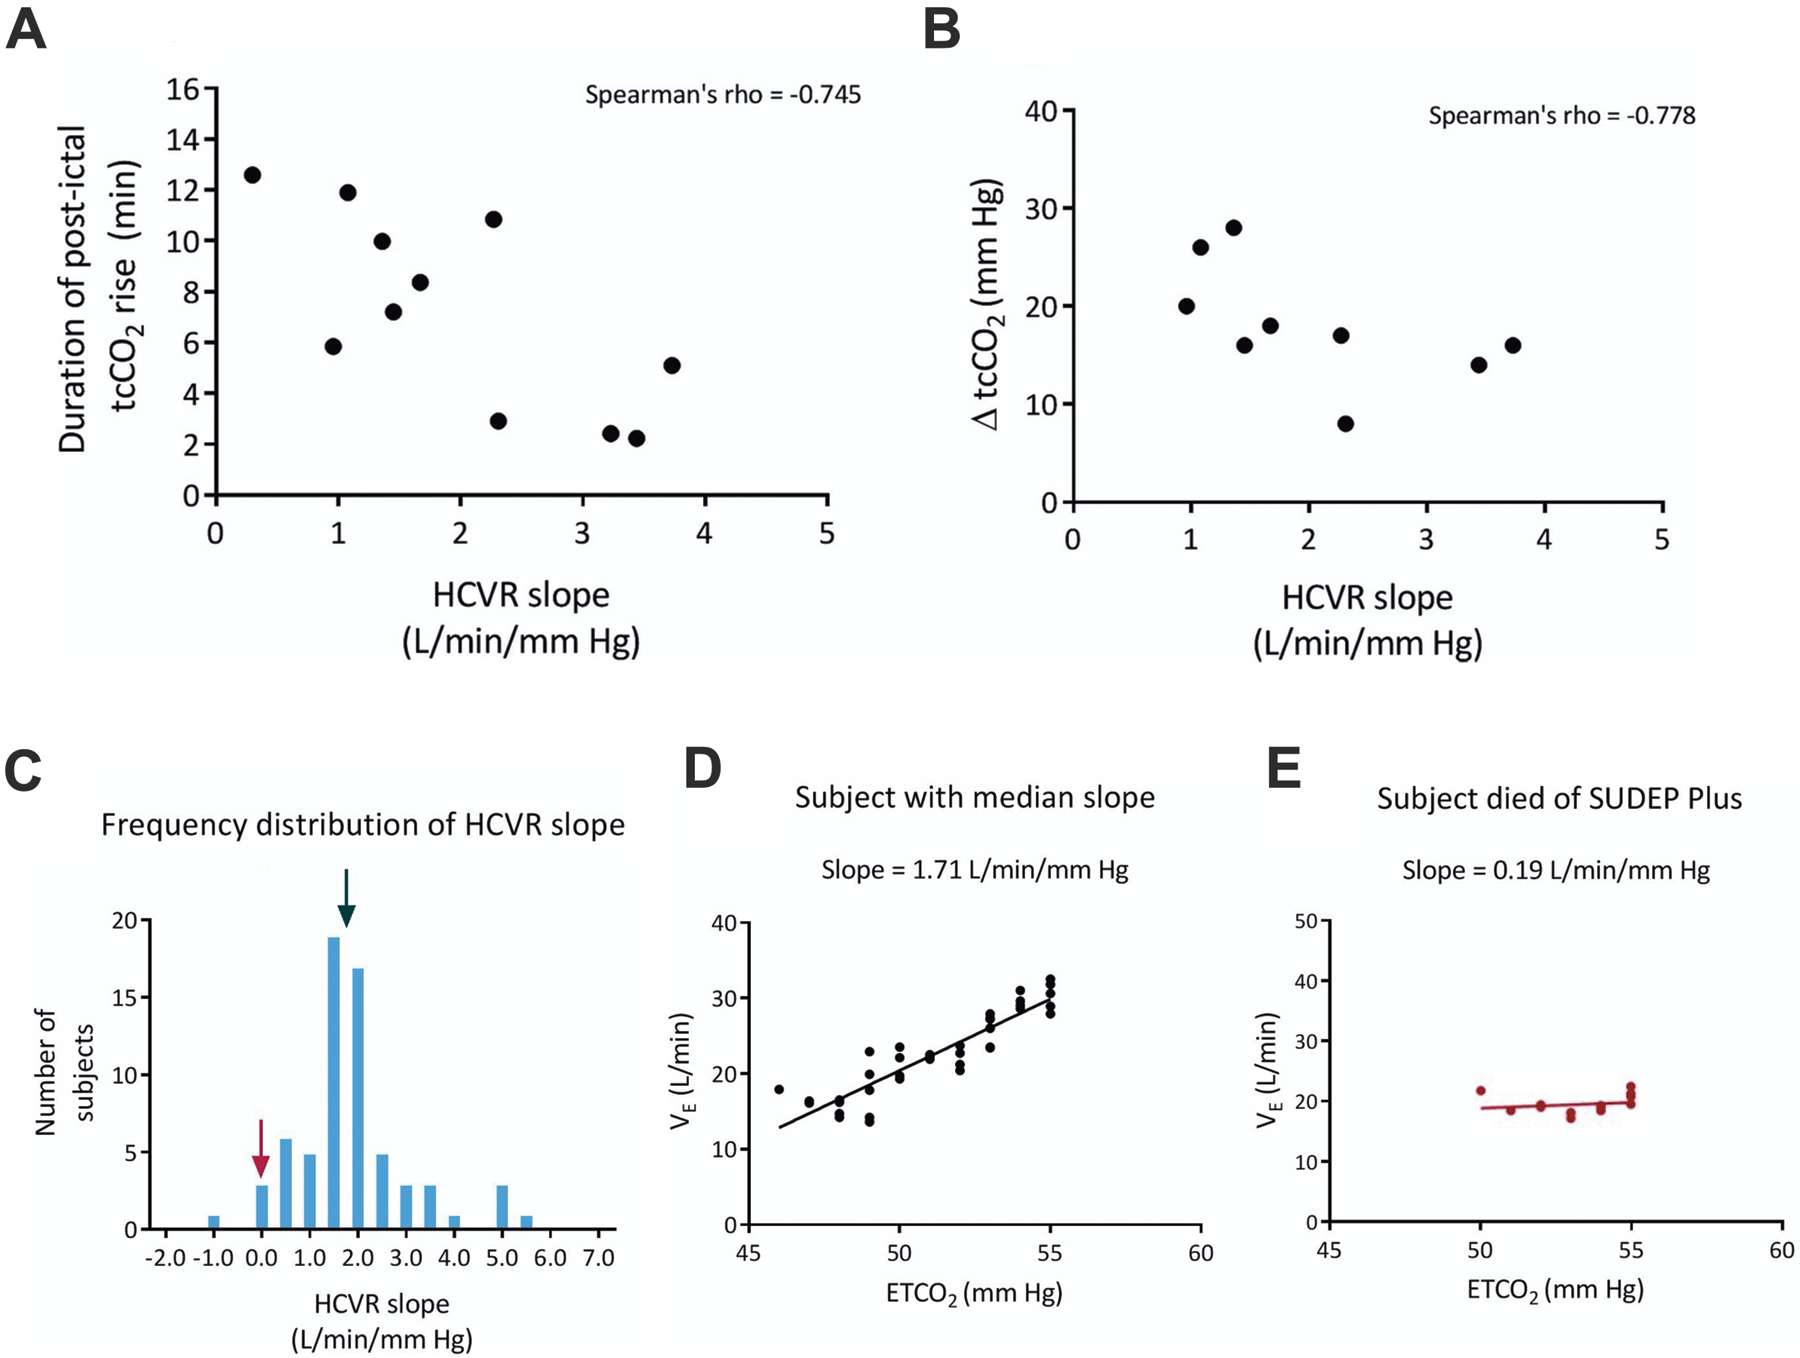
A low interictal HCVR slope is associated with more severe postictal apnea, and may increase the risk of SUDEP in epilepsy patients. A) Scatterplot depicting the correlation between HCVR slope and duration of postictal tcCO2 rise and, B) HCVR and magnitude of postictal tcCO2 rise (ΔtcCO2). C) Frequency distribution of HCVR slopes in epilepsy patients. The black arrow points to the median slope for all patients and the maroon arrow indicates a patient who later died of SUDEP plus. D) Linear regression of VE and ETCO2 for a patient with the median response indicated in (C). E) Linear regression for the patient in (C) shown with the maroon arrow. Adapted with permission from Sainju et al (2019).