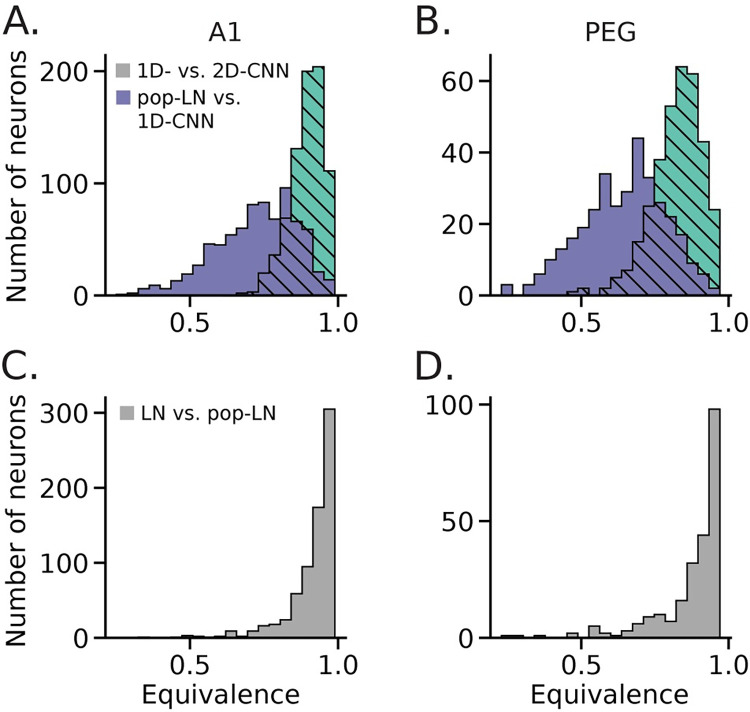
Fig 6. Quantification of equivalence between CNN, pop-LN, and LN exemplar models.
A. Histogram of equivalence (correlation between predicted PSTHs) on the validation data for auditory-responsive A1 neurons (n = 777/849), between 2D CNN and 1Dx2-CNN models (light green, hatched) and between 1Dx2-CNN and pop-LN models (purple). Equivalence was greater between the two CNN models than between the 1Dx2-CNN and pop-LN models (signed-rank test, p = 1.47 x 10−128). This result indicates that CNN models achieved higher prediction accuracy over the LN architectures in similar ways. B. As A, but for PEG neurons (n = 339/398). Here again we observed higher median equivalence between the CNN models (p = 1.64 x 10−55). C. Histogram of equivalence between LN and pop-LN models for A1 neurons. The distribution is shifted even farther toward the 1.0 bound, indicating that the LN and pop-LN models predicted closely matched PSTHs for most neurons. D. As C, but for PEG neurons. The equivalence distribution is similarly right shifted.

