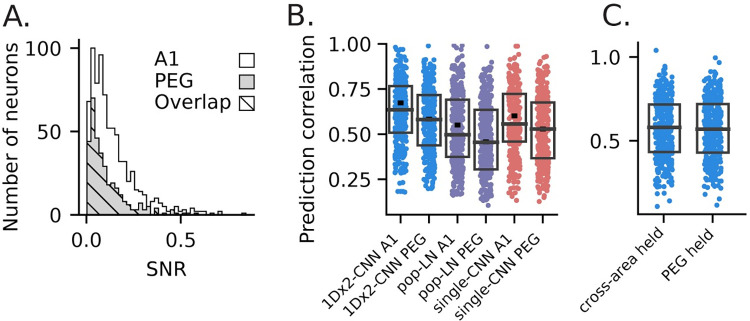
Fig 8. Comparison of model performance between primary (A1) and secondary (PEG) auditory cortical regions after controlling for differences in SNR.
A. SNR scores for all neurons from A1 (white), PEG (gray), and an overlapping subset (hatched) of neurons with matched distributions. Median SNR was higher for A1 (md = 0.0989, U test: p = 2.49 x 10⁻⁶) than for PEG (md = 0.0713), and the A1 subset had a lower median SNR (md = 0.0709) while the median for the PEG subset was mostly unchanged (md = 0.0710). To form the overlapping set, we selected the largest possible subset of neurons from each brain region for which binned distributions of SNR scores for the two subsets were identical. With this approach, the subset was formed primarily by excluding high-SNR neurons from A1 since PEG neural responses were less reliable overall. B. Prediction accuracy of three exemplar models for neurons in the A1 and PEG subsets. Boxes show the 1st, 2nd and 3rd quartile for the selected subset, and the small horizontal dash indicates median performance across all neurons from that brain region. The increase in prediction accuracy for A1 was smaller for this subset, but still significant (U test; 1Dx2-CNN: p = 6.685 x 10⁴; pop-LN: p = 6.743 x 10⁻⁴; single-CNN: p = 4.78 x 10⁻⁴), indicating that the increased SNR of A1 responses only partially accounts for our models’ higher prediction accuracy for A1 neurons. C. Prediction correlation for the 1Dx2-CNN PEG held-out model (Fig 5C, median r = 0.569) and a “cross-area” held-out model (md = 0.581). Pre-fitting to A1 data proved to be just as effective as pre-training on PEG data for predicting PEG neural responses (signed-rank test, p = 0.119).

