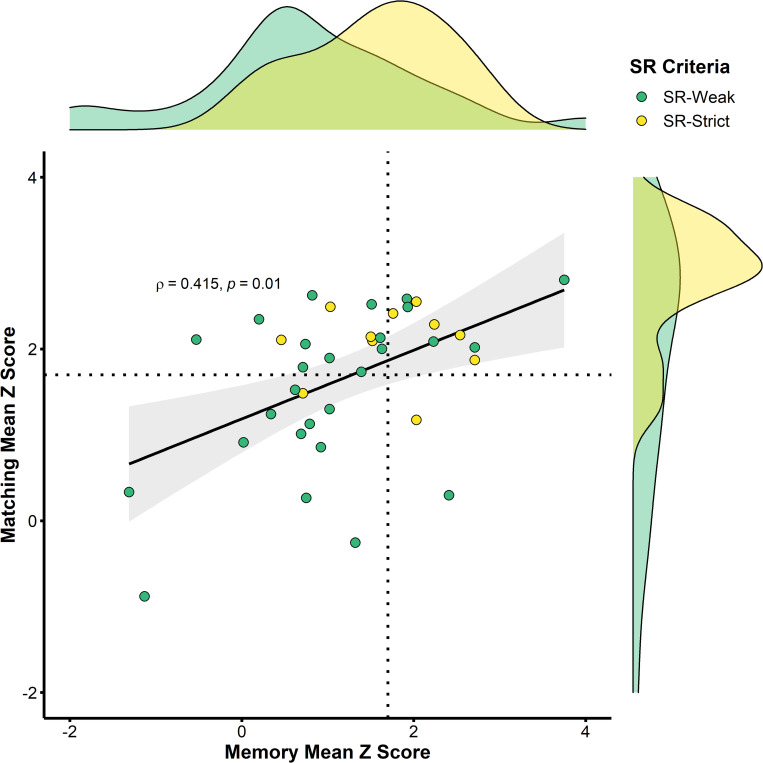
Fig 7. Overall performance of super-recognisers across 7 follow-up face identification tests expressed as z-scores relative to control participant norms.
Positive z-scores show that super-recognisers generally outperformed standard participant groups, but this was more consistent for the groups selected using strict performance criteria (yellow markers) than for those selected using weak criteria (green markers). Dotted lines represent the weak criteria as applied to the follow-up tests (1.7 SD), to illustrate the proportion of selected SRs that continued to meet SR criteria on follow-up testing. Details of this analysis are provided in the main text.

