
Fig. 6.
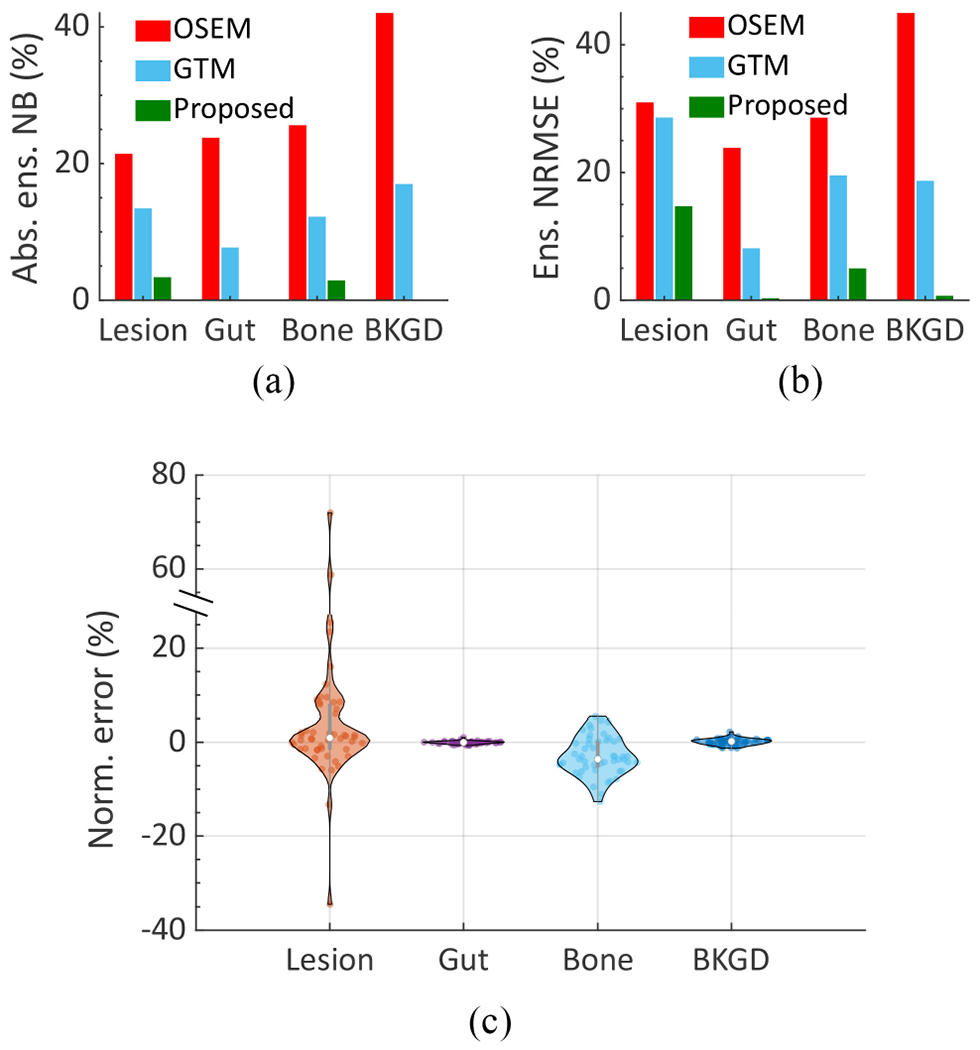
(a) Absolute ensemble NB and (b) ensemble NRMSE of the estimated uptake across different regions using the different methods in the VCT simulating a 223Ra imaging study. (c) A violin plot showing the distribution of the normalized error (normalized by dividing by the true value) using the proposed method across all 50 patients.