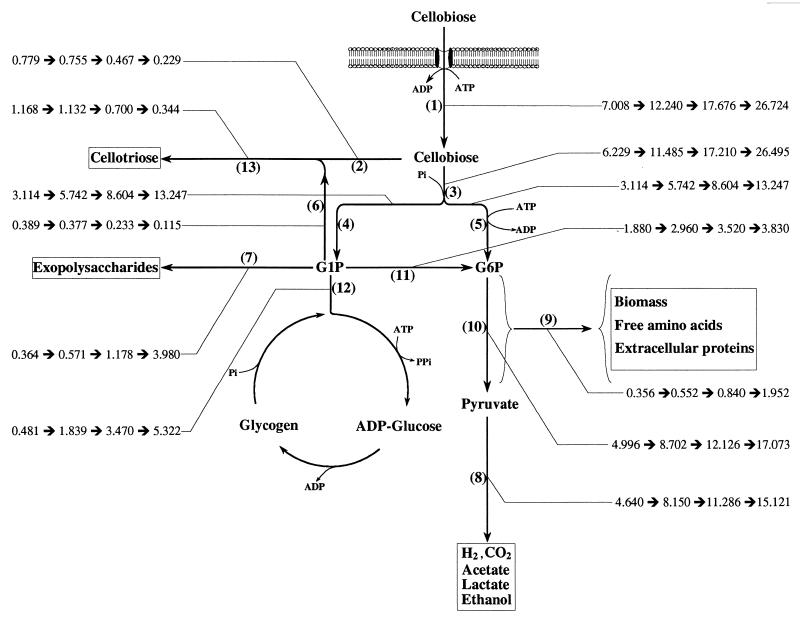
FIG. 1.
Estimation of flux distribution within the central metabolic pathways based on the steady-state kinetic data from continuous culture of C. cellulolyticum grown on cellobiose at four dilution rates (0.013, 0.036, 0.066, and 0.115 h−1). Fluxes are calculated according to the values in Table 1 and Table 2. All fluxes are expressed as meqC per gram of cells per hour and are indicated by a thin line. Specific rates: 1, cellobiose consumption; 2, cellobiose toward cellotriose formation; 3, cellobiose toward G1P and G6P formations; 4, G1P formation; 5, cellobiose toward G6P formation; 6, G1P toward cellotriose formation; 7, G1P toward exopolysaccharide formation; 8, pyruvate formation; 9, G6P toward biosyntheses; 10, G6P formation; 11, G1P through phosphoglucomutase activity; 12, G1P toward glycogen cycle; and 13, cellotriose formation.

