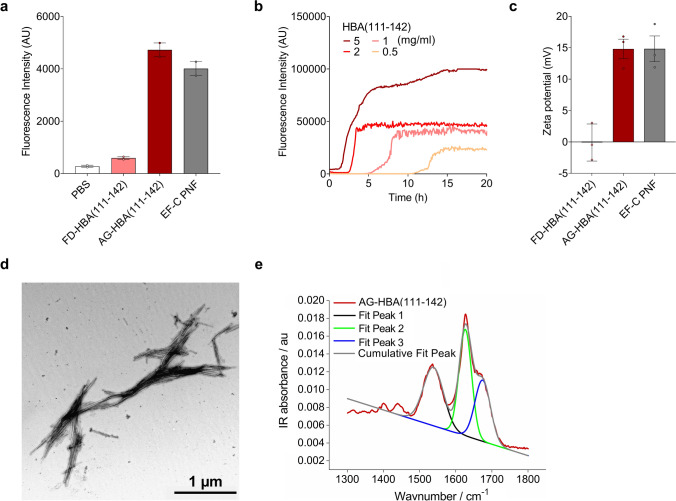
Fig. 2.
Biophysical characteristics of chemically synthesized HBA(111–142). a Freshly dissolved (FD) and agitated (AG) chemically synthesized HBA(111–142) and EF-C PNF as control were incubated with ThT and fluorescence intensity was measured. Shown are the means of two independent experiments performed in duplicates ± SEM. b Aggregation kinetics of HBA(111–142) were determined by incubating different concentrations of the peptide (0.5, 1, 2 or 5 mg/ml) with ThT. c Pre-formed AG-HBA(111–142) was diluted in ddH2O to determine the zeta potential. Positively charged EF-C fibrils were used as control. Samples were analyzed by nanoparticle tracking analysis. Shown are the means of three independent experiments each performed in duplicates ± SEM. d TEM images of AG-HBA(111–142). Samples were negatively stained with 2% uranyl acetate in water on copper grids and imaged with a Jeol TEM 1400. e ATR FT-IR spectra of AG-HBA(111–142). Shown is the peak deconvolution of the FT-IR spectra using three components with peak maxima at 1533 cm−1 (fit 1), 1627 cm−1 (fit 2), and 1674 cm−1 (fit 3) using gaussian shape fits. The peaks can be assigned to the amide II β-sheet, amide I β-sheet and β-turn structures, respectively. The integral ratio between fit 2 and fit 3 was used to quantify the β-sheet amount

