Fig. 6.
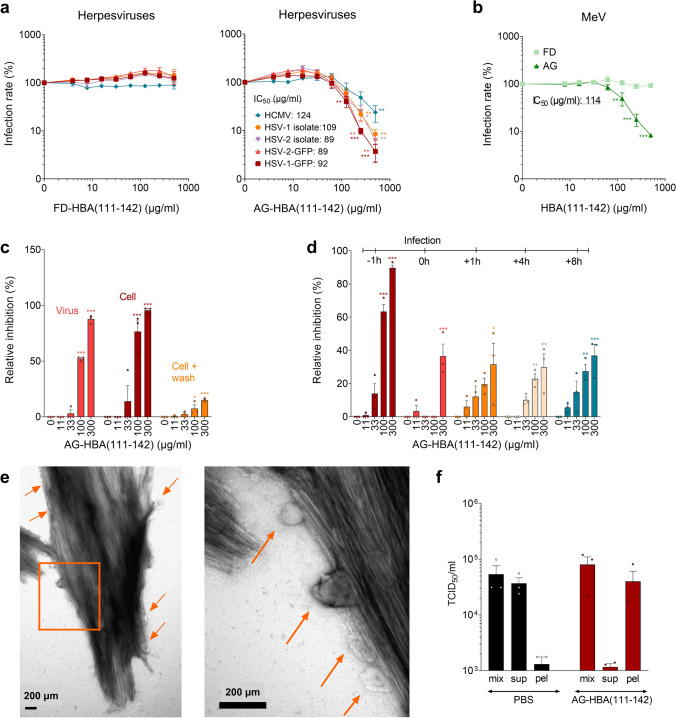
Effect of HBA(111–142) on virus infection. a, b FD- and AG-HBA(111–142) was titrated in PBS, before adding it to the cells. Following a 1 h incubation, respective target cells were infected with HSV-1, HSV-2, HCMV, and MeV. Infection rates were determined one (HSV-1, HSV-2) or two (HCMV and MeV) days post-infection. c HSV-2 was exposed to AG-HBA(111–142) for 1 h, then these mixtures were used to infect cells (virus treatment). Alternatively, indicated concentrations of AG-HBA(111–142) were added to cells and incubated for 1 h before the cells were either directly infected with HSV-2 (cell treatment) or first washed, supplemented with fresh medium, and then infected (wash). d AG-HBA(111–142) at indicated concentrations was added to the cells either 1 h prior to HSV-2 infection, at the time of infection (0 h), or 1, 4, or 8 h post-infection (with the removal of virus, washing, and addition of fresh medium). Infection rates were determined one day post-infection. e AG-HBA(111–142) was incubated with HSV-2 virions at a concentration of 1,000 µg/ml for 10 min. Then, the samples were fixed in PFA at a final concentration of 2%. Samples were negatively stained with 2% uranyl acetate in water on copper grids and imaged with a Jeol TEM 1400. Arrows show virions bound to the fibrils. f HSV-2 was incubated with PBS or 1500 µg/ml AG-HBA(111–142) for 1 h, and then an aliquot was pelleted by centrifugation. The TCID50/ml values of the full mixture (mix), the supernatant (sup) and the resuspended pellet (pel) were determined by infecting Vero cells. For all the cell culture experiments, concentrations indicated represent the final concentration in cell culture. Values shown are means ± SEM derived from three independent experiments performed in triplicates. Significant differences to the control were determined by one-way ANOVA followed by Bonferroni’s multiple comparison test. *p < 0.033, **p < 0.002, ***p < 0.0002

