Exhibit 4.

(figure)
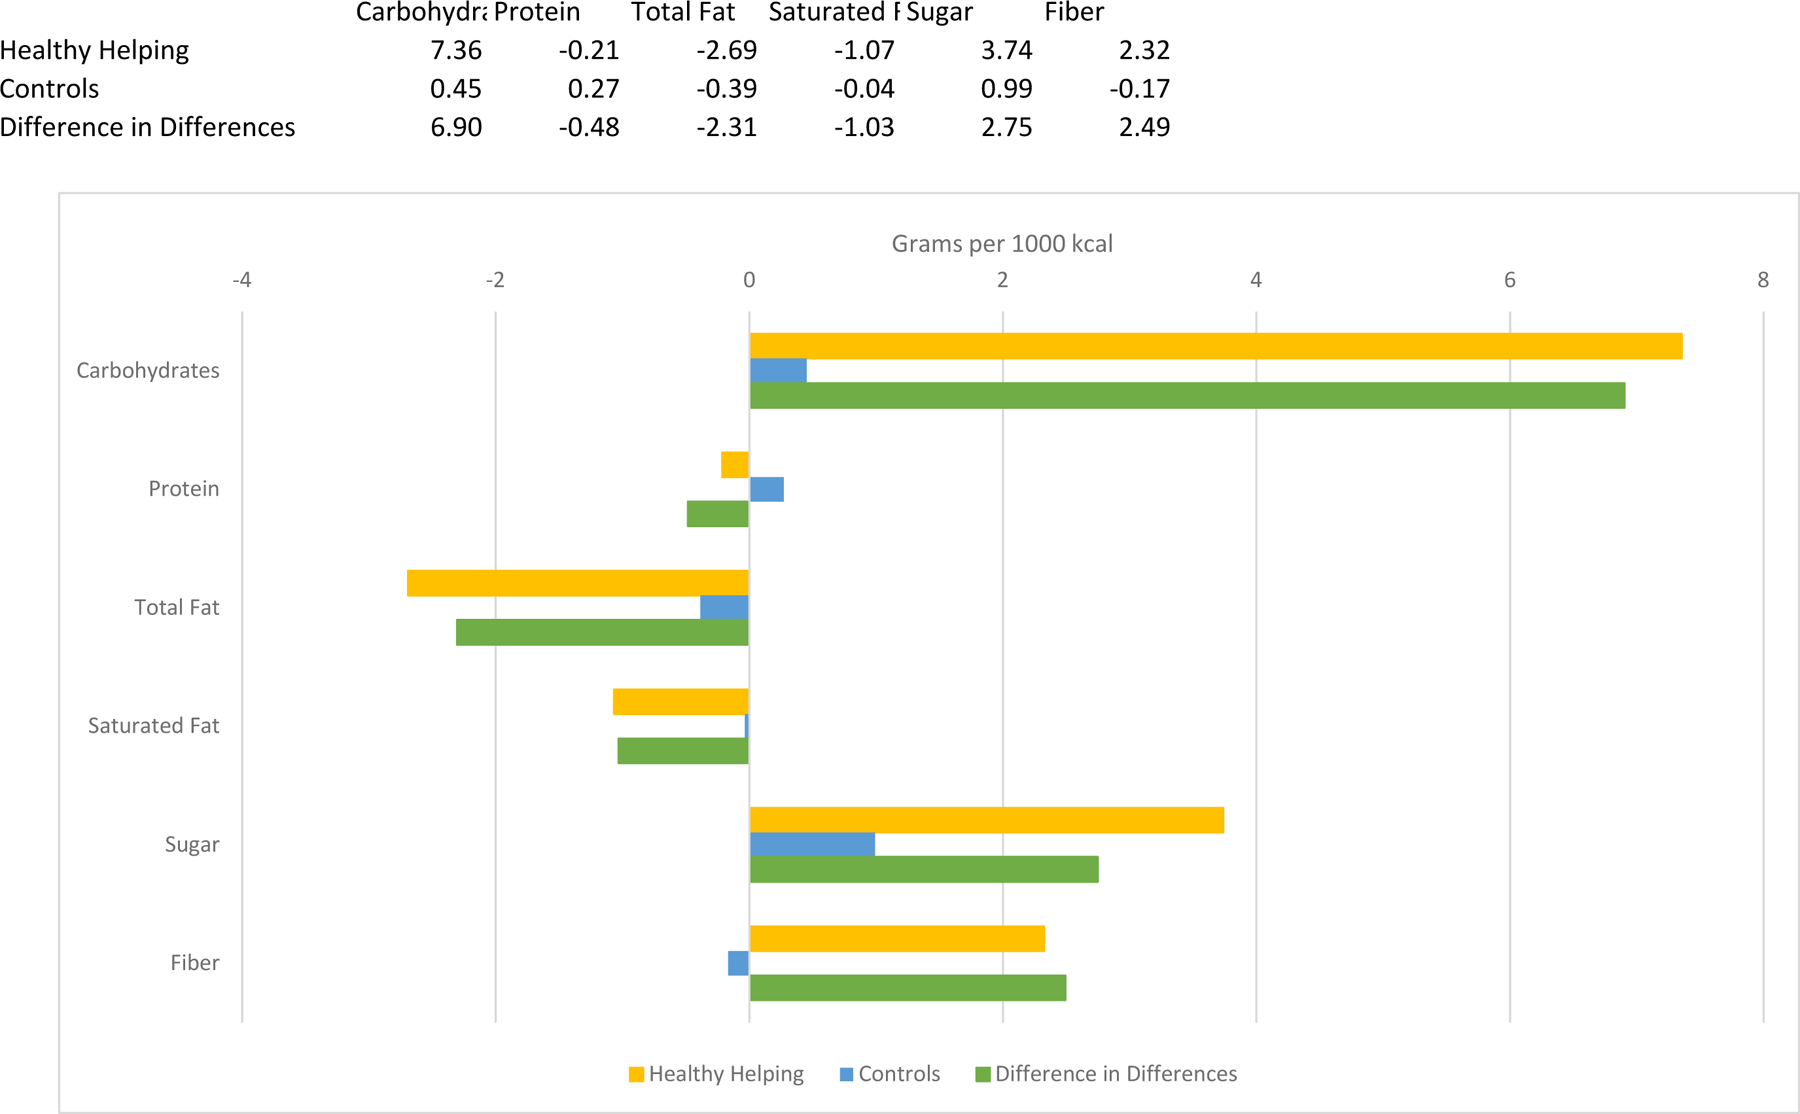
Caption: Changes in nutrient density of Healthy Helping purchases compared with control purchases, North Carolina, October 2019–December 2020
Source/Notes: SOURCE Authors’ analysis of data from a supermarket chain in North Carolina, October 2019–December 2020. NOTES Models include data from 19,722 Healthy Helping enrollees (208,601 shopper-months) and 86,034 control shoppers (804,481 shopper-months). The bars show the change in the quantity of each nutrient per 1,000 kilocalories purchased for the Healthy Helping group and the control group and the difference between the changes in the Healthy Helping and control groups (difference-in-differences). Estimates are from linear mixed models with terms for Healthy Helping participation, time (pre– and post–index month), and a Healthy Helping-by-time product term. Models were also adjusted for month and year; Special Supplemental Nutrition Program for Women, Infants, and Children use; urbanicity of most frequent store; percentage of each food or beverage category missing nutrition information; and number of months of follow-up, with the shopper-month as the unit of analysis. Models include random intercepts for most frequent store and shopper ID. The p values for all difference-in-differences estimates are less than 0.001.
