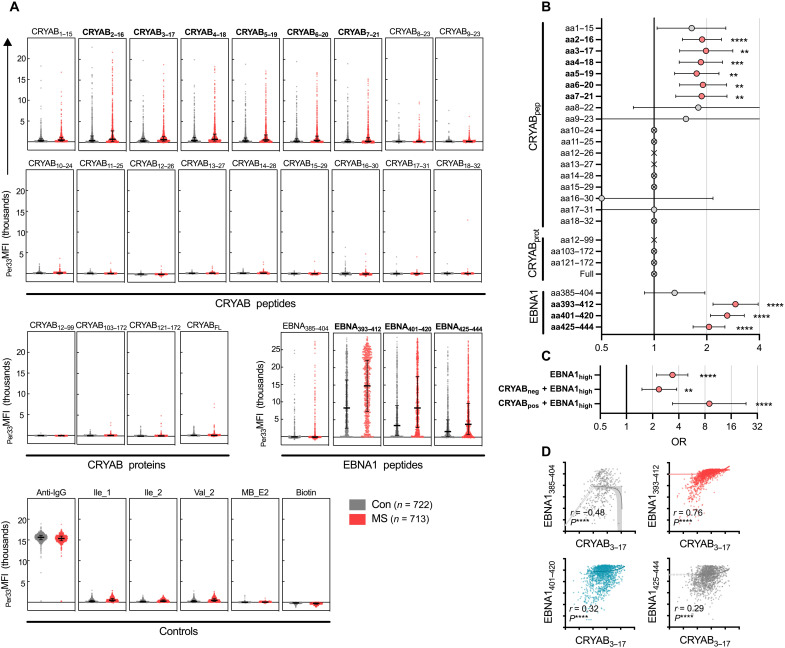
Fig. 1. Increased anti-CRYAB IgG in MS.
Suspension bead array measuring immunoglobulin G (IgG) against alpha-crystallin B (CRYAB) and Epstein-Barr nuclear antigen 1 (EBNA1) using plasma from a cohort of persons with multiple sclerosis (pwMS) (n = 713) and controls (Con) (n = 722). (A) Background-adjusted mean fluorescent intensity [33rd percentile MFI (Per33MFI)] values of CRYAB-stepped peptides (top panel), CRYAB protein fragments and CRYAB full length protein (CRYABFL) (middle left panel), EBNA1 peptides associated with MS risk (middle right panel), and controls (bottom panel). Each dot represents one individual, and staples denote the median and interquartile range (IQR). (B) Odds ratio (ORs) of MS versus Con for the different reactivities in (A), with positive responses defined as >99.9th percentile of negative control peptide responses. ORs were calculated using the Baptista-Pike method with Fisher’s exact test for P values and Holm-Sidak correction for multiple comparisons. Staples denote 95% confidence interval (CI). ORs based on 1 or 0 events are depicted as crossed circles (>infinity) or as a cross (no OR). aa, amino acids. (C) ORs for combinations of antibody responses: EBNA1-high responders (defined as >median + 2 SD of Con response), EBNA1-high and CRYAB-negative responders, and EBNA1-high and CRYAB-positive responders. CRYAB positivity is defined as in (B) and is based on CRYAB3–17. The ORs were calculated as MS versus Con. For both (B) and (C), the exact number of positive and negative individuals is presented in table S2. (D) Correlation between CRYAB3–17 responses and EBNA1 responses (log10 Per33MFI). Spearman correlation coefficient (r) and P values are indicated. The lines and highlighted areas represent linear regression slopes and the 95% CI of slopes. For the whole figure, *P < 0.05; **P < 0.01; ***P < 0.001; ****P < 0.0001 (adjusted P values).

