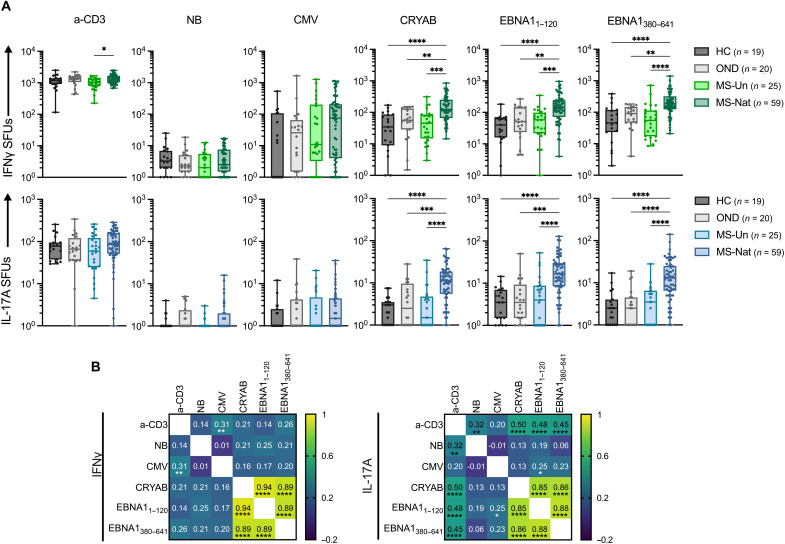
Fig. 4. Increased circulating autoreactive CRYAB-specific cells in MS-Nat.
(A) Number of interferon γ (IFNγ; top graphs) and interleukin-17A (IL-17A; bottom graphs) spot-forming units (SFUs) in a FluoroSpot assay after NB negative control, CRYAB, and EBNA1 stimulations. SFUs <1 are plotted as 1. Boxes represent median ± IQR. Statistical significance was calculated with a nonparametric, two-tailed Kruskal-Wallis test with Dunn’s multiple comparison test. Each group was compared with every other group, and P values are indicated where significant. *P < 0.05; **P < 0.01; ***P < 0.001; ****P < 0.0001. CMV, cytomegalovirus; MS-Un, untreated pwMS; MS-Nat, natalizumab-treated pwMS; HC, healthy control; OND, other neurological disease controls. (B) Correlation matrix of individual’s responses to the different stimulations [based on the data in (A)]. r and P values were calculated using nonparametric Spearman correlation with Holm-Sidak correction for multiple comparisons. Each comparison’s r value is written in the corresponding cell. P values are denoted when significant. *P < 0.05; **P < 0.01; ****P < 0.0001.

